Blog
- Home
- Blog
Understanding Bayesian A/B testing (using baseball statistics)
Written by Sayed Jamal MirkamaliWell, Mike Piazza has a slightly higher career batting average (2127 hits / 6911 at-bats = 0.308) than Hank Aaron (3771 hits / 12364 at-bats = 0.305). But can we say with confidence that his skill is actually higher, or is it possible he just got lucky a bit more often?
In this series of posts about an empirical Bayesian approach to batting statistics, we’ve been estimating batting averages by modeling them as a binomial distribution with a beta prior. But we’ve been looking at a single batter at a time. What if we want to compare two batters, give a probability that one is better than the other, and estimate by how much?
This is a topic rather relevant to my own work and to the data science field, because understanding the difference between two proportions is important in A/B testing. One of the most common examples of A/B testing is comparing clickthrough rates (“out of X impressions, there have been Y clicks”)- which on the surface is similar to our batting average estimation problem (“out of X at-bats, there have been Y hits””).1
Here, we’re going to look at an empirical Bayesian approach to comparing two batters.2 We’ll define the problem in terms of the difference between each batter’s posterior distribution, and look at four mathematical and computational strategies we can use to resolve this question. While we’re focusing on baseball here, remember that similar strategies apply to A/B testing, and indeed to many Bayesian models.
Python - Kernel tricks and nonlinear dimensionality reduction via RBF kernel PCA
Written by Sayed Jamal Mirkamali
Most machine learning algorithms have been developed and statistically validated for linearly separable data. Popular examples are linear classifiers like Support Vector Machines (SVMs) or the (standard) Principal Component Analysis (PCA) for dimensionality reduction. However, most real world data requires nonlinear methods in order to perform tasks that involve the analysis and discovery of patterns successfully.
The focus of this article is to briefly introduce the idea of kernel methods and to implement a Gaussian radius basis function (RBF) kernel that is used to perform nonlinear dimensionality reduction via BF kernel principal component analysis (kPCA).
Machine Learning is dead - Long live machine learning!
Written by Sayed Jamal Mirkamali
You may be thinking that this title makes no sense at all. ML, AI, ANN and Deep learning have made it into the everyday lexicon and here I am, proclaiming that ML is dead. Well, here is what I mean…
The open sourcing of entire ML frameworks marks the end of a phase of rapid development of tools, and thus marks the death of ML as we have known it so far. The next phase will be marked with ubiquitous application of these tools into software applications. And that is how ML will live forever, because it will seamlessly and inextricably integrate into our lives.
Rootograms, A new way to assess count models
Written by Sayed Jamal Mirkamali
Assessing the fit of a count regression model is not necessarily a straightforward enterprise; often we just look at residuals, which invariably contain patterns of some form due to the discrete nature of the observations, or we plot observed versus fitted values as a scatter plot. Recently, while perusing the latest statistics offerings on ArXiv I came across Kleiber and Zeileis (2016) who propose the rootogram as an improved approach to the assessment of fit of a count regression model. The paper is illustrated using R and the authors’ countreg package (currently on R-Forge only). Here, I thought I’d take a quick look at the rootogram with some simulated species abundance data.
The concept is certainly compelling. Having a machine capable of reacting to real-world visual, auditory or other type of data and then responding, in an intelligent way, has been the stuff of science fiction until very recently. We are now on the verge of this new reality with little general understanding of what it is that artificial intelligence, convolutional neural networks, and deep learning can (and can’t) do, nor what it takes to make them work. At the simplest level, much of the current efforts around deep learning involve very rapid recognition and classification of objects—whether visual, audible, or some other form of digital data. Using cameras, microphones and other types of sensors, data is input into a system that contains a multi-level set of filters that provide increasingly detailed levels of differentiation. Think of it like the animal or plant classification charts from your grammar school days: Kingdom, Phylum, Class, Order, Family, Genus, Species.
Search
Archive
Latest Posts
Latest Comments
K2 Content
-
 A synergetic R-Shiny portal for modeling and tracking of COVID-19 data
Written by S. Morteza NajibiWritten on Friday, 08 January 2021 07:03 in SDAT News Read 5015 times Read more...
A synergetic R-Shiny portal for modeling and tracking of COVID-19 data
Written by S. Morteza NajibiWritten on Friday, 08 January 2021 07:03 in SDAT News Read 5015 times Read more...
Dr. Mahdi Salehi, an associate member of SDAT and assistant professor of statistics at the University of Neyshabur, introduced a useful online interactive dashboard that visualize and follows confirmed cases of COVID-19 in real-time. The dashboard was publicly made available on 6 April 2020 to illustrate the counts of confirmed cases, deaths, and recoveries of COVID-19 at the level of country or continent. This dashboard is intended as a user-friendly dashboard for researchers as well as the general public to track the COVID-19 pandemic, and is generated from trusted data sources and built-in open-source R software (Shiny in particular); ensuring a high sense of transparency and reproducibility.
Access the shiny dashboard: https://mahdisalehi.shinyapps.io/Covid19Dashboard/
-
First Event on Play with Real Data
Written by S. Morteza NajibiWritten on Wednesday, 23 December 2020 13:45 in SDAT News Read 5295 times Read more...
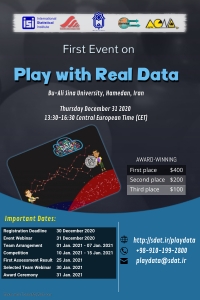
Scientific Data Analysis Team (SDAT) intends to organize the first event on the value of data to provide data holders and data analyzers with an opportunity to extract maximum value from their data. This event is organized by International Statistical Institute (ISI) and SDAT hosted at the Bu-Ali Sina University, Hamedan, Iran.
Organizers and the data providers will provide more information about the goals of the initial ideas, team arrangement, competition processes, and the benefits of attending this event on a webinar hosted at the ISI Gotowebianr system. Everyone invites to participate in this webinar for free, but it is needed to register at the webinar system by 30 December 2020.
Event Time: 31 December 2020 - 13:30-16:30 Central European Time (CET)
Register for the webinar: https://register.gotowebinar.com/register/8913834636664974352
More details about this event: http://sdat.ir/en/playdata
Aims and outputs:
• Playing with real data by explorative and predictive data analysis techniques
• A platform between a limited number of data providers and hundreds to thousands of data scientist Teams
• Improving creativity and scientific reasoning of data scientist and statisticians
• Finding the possible “bugs” with the current data analysis methods and new developments
• Learn different views about a dataset.AWARD-WINNING:
The best-report awards consist of a cash prize:
$400 for first place,
$200 for second place, and
$100 for third place.Important Dates:
Event Webinar: 31 December 2020 - 13:30-16:30 Central European Time (CET).
Team Arrangement: 01 Jan. 2021 - 07 Jan. 2021
Competition: 10 Jan. 2021 - 15 Jan. 2021
First Assessment Result: 25 Jan. 2021
Selected Teams Webinar: 30 Jan. 2021
Award Ceremony: 31 Jan. 2021Please share this event with your colleagues, students, and data analyzers.
-
Development of Neuroimaging Symposium and Advanced fMRI Data Analysis
Written by S. Morteza NajibiWritten on Sunday, 21 April 2019 12:18 in SDAT News Read 5437 times Read more...

The Developement of Structural and Functional Neuroimaging Symposium hold at the School of Sciences, Shiraz University in April 17 2019. The Advanced fMRI Data Analysis Workshop also held in April 18-19 2019. For more information please visit: http://sdat.ir/dns98
-
Releasing Rfssa Package by SDAT Members at CRAN
Written by S. Morteza NajibiWritten on Sunday, 03 March 2019 21:03 in SDAT News Read 3929 times
The Rfssa package is available at CRAN. Dr. Hossein Haghbin and Dr. Seyed Morteza Najibi (SDAT Members) have published this package to provide the collections of necessary functions to implement Functional Singular Spectrum Analysis (FSSA) for analysing Functional Time Series (FTS). FSSA is a novel non-parametric method to perform decomposition and reconstruction of FTS. For more information please visit github homepage of package.
-
Data Science Symposium
Written by S. Morteza NajibiWritten on Friday, 01 February 2019 00:13 in SDAT News Read 5459 times Read more...
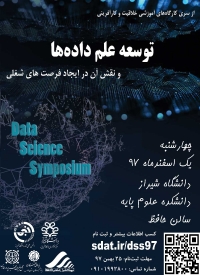
Symposium of Data Science Developement and its job opportunities hold at the Faculty of Science, Shiraz University in Feb 20 2019. For more information please visit: http://sdat.ir/dss97
Tags
About Us
SDAT is an abbreviation for Scientific Data Analysis Team. It consists of groups who are specialists in various fields of data sciences including Statistical Analytics, Business Analytics, Big Data Analytics and Health Analytics.
Get In Touch
Address: No.15 13th West Street, North Sarrafan, Apt. No. 1 Saadat Abad- Tehran
Phone: +98-910-199-2800
Email: info@sdat.ir
Login Form
Joomla! Debug Console
{
"__default": {
"session": {
"counter": 1,
"timer": {
"start": 1756484945,
"last": 1756484945,
"now": 1756484945
},
"token": "715tyzvFXcDQQTxrTc9mmyPjCp2jqRMu"
},
"registry": {},
"user": {
"id": 0,
"name": null,
"username": null,
"email": null,
"password": null,
"password_clear": "",
"block": null,
"sendEmail": 0,
"registerDate": null,
"lastvisitDate": null,
"activation": null,
"params": null,
"groups": [],
"guest": 1,
"lastResetTime": null,
"resetCount": null,
"requireReset": null,
"aid": 0
},
"plg_system_languagefilter": {
"language": "en-GB"
}
}
}
Time
Memory
185 Queries Logged 132.86 ms
42 duplicate found!
- Query Time: 0.94 ms Query memory: 0.005 MB Memory before query: 4.285 MB Rows returned: 0
SELECT `session_id`
FROM `w0v41_session`
WHERE `session_id` = X'3263316135326537646232366461343764646339343931653135363736373138'
LIMIT 1id select_type table partitions type possible_keys key key_len ref rows filtered Extra 1 SIMPLE w0v41_session NULL const PRIMARY PRIMARY 194 const 1 100.00 Using index No SHOW PROFILE (maybe because there are more than 100 queries)# Caller File and line number 9 JDatabaseDriverMysqli->execute() JROOT/libraries/joomla/database/driver.php:1740 8 JDatabaseDriver->loadResult() JROOT/libraries/src/Session/MetadataManager.php:74 7 Joomla\CMS\Session\MetadataManager->createRecordIfNonExisting() JROOT/libraries/src/Application/CMSApplication.php:154 6 Joomla\CMS\Application\CMSApplication->checkSession() JROOT/libraries/src/Application/CMSApplication.php:828 5 Joomla\CMS\Application\CMSApplication->loadSession() JROOT/libraries/src/Application/CMSApplication.php:136 4 Joomla\CMS\Application\CMSApplication->__construct() JROOT/libraries/src/Application/SiteApplication.php:66 3 Joomla\CMS\Application\SiteApplication->__construct() JROOT/libraries/src/Application/CMSApplication.php:386 2 Joomla\CMS\Application\CMSApplication::getInstance() JROOT/libraries/src/Factory.php:140 1 Joomla\CMS\Factory::getApplication() JROOT/index.php:46 - Query Time: 1.63 ms After last query: 0.09 ms Query memory: 0.004 MB Memory before query: 4.290 MB
INSERT INTO `w0v41_session` (`session_id`,`guest`,`time`,`userid`,`username`,`client_id`)
VALUES (X'3263316135326537646232366461343764646339343931653135363736373138', 1, 1756484945, 0, '', 0)EXPLAIN not possible on query: INSERT INTO `w0v41_session` (`session_id`,`guest`,`time`,`userid`,`username`,`client_id`) VALUES (X'3263316135326537646232366461343764646339343931653135363736373138', 1, 1756484945, 0, '', 0)No SHOW PROFILE (maybe because there are more than 100 queries)# Caller File and line number 8 JDatabaseDriverMysqli->execute() JROOT/libraries/src/Session/MetadataManager.php:116 7 Joomla\CMS\Session\MetadataManager->createRecordIfNonExisting() JROOT/libraries/src/Application/CMSApplication.php:154 6 Joomla\CMS\Application\CMSApplication->checkSession() JROOT/libraries/src/Application/CMSApplication.php:828 5 Joomla\CMS\Application\CMSApplication->loadSession() JROOT/libraries/src/Application/CMSApplication.php:136 4 Joomla\CMS\Application\CMSApplication->__construct() JROOT/libraries/src/Application/SiteApplication.php:66 3 Joomla\CMS\Application\SiteApplication->__construct() JROOT/libraries/src/Application/CMSApplication.php:386 2 Joomla\CMS\Application\CMSApplication::getInstance() JROOT/libraries/src/Factory.php:140 1 Joomla\CMS\Factory::getApplication() JROOT/index.php:46 - Query Time: 0.48 ms After last query: 9.89 ms Query memory: 0.005 MB Memory before query: 4.876 MB Rows returned: 7
SELECT id, rules
FROM `w0v41_viewlevels`id select_type table partitions type possible_keys key key_len ref rows filtered Extra 1 SIMPLE w0v41_viewlevels NULL ALL NULL NO INDEX KEY COULD BE USED NULL NULL 7 100.00 NULL No SHOW PROFILE (maybe because there are more than 100 queries)# Caller File and line number 10 JDatabaseDriverMysqli->execute() JROOT/libraries/joomla/database/driver.php:1506 9 JDatabaseDriver->loadAssocList() JROOT/libraries/src/Access/Access.php:1063 8 Joomla\CMS\Access\Access::getAuthorisedViewLevels() JROOT/libraries/src/User/User.php:458 7 Joomla\CMS\User\User->getAuthorisedViewLevels() JROOT/libraries/src/Plugin/PluginHelper.php:318 6 Joomla\CMS\Plugin\PluginHelper::load() JROOT/libraries/src/Plugin/PluginHelper.php:87 5 Joomla\CMS\Plugin\PluginHelper::getPlugin() JROOT/libraries/src/Plugin/PluginHelper.php:129 4 Joomla\CMS\Plugin\PluginHelper::isEnabled() JROOT/libraries/src/Application/SiteApplication.php:604 3 Joomla\CMS\Application\SiteApplication->initialiseApp() JROOT/libraries/src/Application/SiteApplication.php:212 2 Joomla\CMS\Application\SiteApplication->doExecute() JROOT/libraries/src/Application/CMSApplication.php:225 1 Joomla\CMS\Application\CMSApplication->execute() JROOT/index.php:49 - Query Time: 0.59 ms After last query: 0.08 ms Query memory: 0.005 MB Memory before query: 4.889 MB Rows returned: 2
SELECT b.id
FROM w0v41_usergroups AS a
LEFT JOIN w0v41_usergroups AS b
ON b.lft <= a.lft
AND b.rgt >= a.rgt
WHERE a.id = 9id select_type table partitions type possible_keys key key_len ref rows filtered Extra 1 SIMPLE a NULL const PRIMARY PRIMARY 4 const 1 100.00 NULL 1 SIMPLE b NULL range idx_usergroup_nested_set_lookup idx_usergroup_nested_set_lookup 4 NULL 2 100.00 Using where; Using index No SHOW PROFILE (maybe because there are more than 100 queries)# Caller File and line number 11 JDatabaseDriverMysqli->execute() JROOT/libraries/joomla/database/driver.php:1550 10 JDatabaseDriver->loadColumn() JROOT/libraries/src/Access/Access.php:980 9 Joomla\CMS\Access\Access::getGroupsByUser() JROOT/libraries/src/Access/Access.php:1095 8 Joomla\CMS\Access\Access::getAuthorisedViewLevels() JROOT/libraries/src/User/User.php:458 7 Joomla\CMS\User\User->getAuthorisedViewLevels() JROOT/libraries/src/Plugin/PluginHelper.php:318 6 Joomla\CMS\Plugin\PluginHelper::load() JROOT/libraries/src/Plugin/PluginHelper.php:87 5 Joomla\CMS\Plugin\PluginHelper::getPlugin() JROOT/libraries/src/Plugin/PluginHelper.php:129 4 Joomla\CMS\Plugin\PluginHelper::isEnabled() JROOT/libraries/src/Application/SiteApplication.php:604 3 Joomla\CMS\Application\SiteApplication->initialiseApp() JROOT/libraries/src/Application/SiteApplication.php:212 2 Joomla\CMS\Application\SiteApplication->doExecute() JROOT/libraries/src/Application/CMSApplication.php:225 1 Joomla\CMS\Application\CMSApplication->execute() JROOT/index.php:49 - Query Time: 0.78 ms After last query: 37.48 ms Query memory: 0.005 MB Memory before query: 7.589 MB Rows returned: 1
SELECT `name`
FROM `w0v41_extensions`
WHERE `type` = 'package'
AND `element` = 'pkg_eventgallery_full'id select_type table partitions type possible_keys key key_len ref rows filtered Extra 1 SIMPLE w0v41_extensions NULL ref element_clientid,element_folder_clientid,extension element_clientid 402 const 1 10.00 Using where No SHOW PROFILE (maybe because there are more than 100 queries)# Caller File and line number 10 JDatabaseDriverMysqli->execute() JROOT/libraries/joomla/database/driver.php:1740 9 JDatabaseDriver->loadResult() JROOT/administrator/components/com_eventgallery/version.php:24 8 include_once JROOT/administrator/components/com_eventgallery/version.php JROOT/plugins/system/picasaupdater/picasaupdater.php:32 7 plgSystemPicasaupdater->__construct() JROOT/libraries/src/Plugin/PluginHelper.php:280 6 Joomla\CMS\Plugin\PluginHelper::import() JROOT/libraries/src/Plugin/PluginHelper.php:182 5 Joomla\CMS\Plugin\PluginHelper::importPlugin() JROOT/libraries/src/Application/CMSApplication.php:667 4 Joomla\CMS\Application\CMSApplication->initialiseApp() JROOT/libraries/src/Application/SiteApplication.php:686 3 Joomla\CMS\Application\SiteApplication->initialiseApp() JROOT/libraries/src/Application/SiteApplication.php:212 2 Joomla\CMS\Application\SiteApplication->doExecute() JROOT/libraries/src/Application/CMSApplication.php:225 1 Joomla\CMS\Application\CMSApplication->execute() JROOT/index.php:49 - Query Time: 0.79 ms After last query: 17.61 ms Query memory: 0.007 MB Memory before query: 8.280 MB Rows returned: 1Duplicate queries: #7
SELECT template
FROM w0v41_template_styles as s
WHERE s.client_id = 0
AND s.home = 1id select_type table partitions type possible_keys key key_len ref rows filtered Extra 1 SIMPLE s NULL ref idx_client_id,idx_client_id_home idx_client_id 1 const 6 12.50 Using where No SHOW PROFILE (maybe because there are more than 100 queries)# Caller File and line number 14 JDatabaseDriverMysqli->execute() JROOT/libraries/joomla/database/driver.php:1740 13 JDatabaseDriver->loadResult() JROOT/libraries/rokcommon/RokCommon/PlatformInfo/Joomla.php:31 12 RokCommon_PlatformInfo_Joomla->getDefaultTemplate() JROOT/libraries/rokcommon/RokCommon/PlatformInfo/Joomla.php:105 11 RokCommon_PlatformInfo_Joomla->setPlatformParameters() JROOT/libraries/rokcommon/RokCommon/Service.php:71 10 RokCommon_Service::getContainer() JROOT/libraries/rokcommon/include.php:38 9 require_once JROOT/libraries/rokcommon/include.php JROOT/plugins/system/rokcommon/rokcommon.php:95 8 plgSystemRokCommon->loadCommonLib() JROOT/plugins/system/rokcommon/rokcommon.php:53 7 plgSystemRokCommon->__construct() JROOT/libraries/src/Plugin/PluginHelper.php:280 6 Joomla\CMS\Plugin\PluginHelper::import() JROOT/libraries/src/Plugin/PluginHelper.php:182 5 Joomla\CMS\Plugin\PluginHelper::importPlugin() JROOT/libraries/src/Application/CMSApplication.php:667 4 Joomla\CMS\Application\CMSApplication->initialiseApp() JROOT/libraries/src/Application/SiteApplication.php:686 3 Joomla\CMS\Application\SiteApplication->initialiseApp() JROOT/libraries/src/Application/SiteApplication.php:212 2 Joomla\CMS\Application\SiteApplication->doExecute() JROOT/libraries/src/Application/CMSApplication.php:225 1 Joomla\CMS\Application\CMSApplication->execute() JROOT/index.php:49 - Query Time: 0.35 ms After last query: 0.07 ms Query memory: 0.007 MB Memory before query: 8.287 MB Rows returned: 1Duplicate queries: #6
SELECT template
FROM w0v41_template_styles as s
WHERE s.client_id = 0
AND s.home = 1id select_type table partitions type possible_keys key key_len ref rows filtered Extra 1 SIMPLE s NULL ref idx_client_id,idx_client_id_home idx_client_id 1 const 6 12.50 Using where No SHOW PROFILE (maybe because there are more than 100 queries)# Caller File and line number 15 JDatabaseDriverMysqli->execute() JROOT/libraries/joomla/database/driver.php:1740 14 JDatabaseDriver->loadResult() JROOT/libraries/rokcommon/RokCommon/PlatformInfo/Joomla.php:31 13 RokCommon_PlatformInfo_Joomla->getDefaultTemplate() JROOT/libraries/rokcommon/RokCommon/PlatformInfo/Joomla.php:67 12 RokCommon_PlatformInfo_Joomla->getDefaultTemplatePath() JROOT/libraries/rokcommon/RokCommon/PlatformInfo/Joomla.php:106 11 RokCommon_PlatformInfo_Joomla->setPlatformParameters() JROOT/libraries/rokcommon/RokCommon/Service.php:71 10 RokCommon_Service::getContainer() JROOT/libraries/rokcommon/include.php:38 9 require_once JROOT/libraries/rokcommon/include.php JROOT/plugins/system/rokcommon/rokcommon.php:95 8 plgSystemRokCommon->loadCommonLib() JROOT/plugins/system/rokcommon/rokcommon.php:53 7 plgSystemRokCommon->__construct() JROOT/libraries/src/Plugin/PluginHelper.php:280 6 Joomla\CMS\Plugin\PluginHelper::import() JROOT/libraries/src/Plugin/PluginHelper.php:182 5 Joomla\CMS\Plugin\PluginHelper::importPlugin() JROOT/libraries/src/Application/CMSApplication.php:667 4 Joomla\CMS\Application\CMSApplication->initialiseApp() JROOT/libraries/src/Application/SiteApplication.php:686 3 Joomla\CMS\Application\SiteApplication->initialiseApp() JROOT/libraries/src/Application/SiteApplication.php:212 2 Joomla\CMS\Application\SiteApplication->doExecute() JROOT/libraries/src/Application/CMSApplication.php:225 1 Joomla\CMS\Application\CMSApplication->execute() JROOT/index.php:49 - Query Time: 0.51 ms After last query: 6.63 ms Query memory: 0.005 MB Memory before query: 8.533 MB Rows returned: 2
SELECT extension, file, type
FROM w0v41_rokcommon_configs
ORDER BY priorityid select_type table partitions type possible_keys key key_len ref rows filtered Extra 1 SIMPLE w0v41_rokcommon_configs NULL ALL NULL NO INDEX KEY COULD BE USED NULL NULL 2 100.00 Using filesort No SHOW PROFILE (maybe because there are more than 100 queries)# Caller File and line number 10 JDatabaseDriverMysqli->execute() JROOT/libraries/joomla/database/driver.php:1701 9 JDatabaseDriver->loadObjectList() JROOT/plugins/system/rokcommon/rokcommon.php:131 8 plgSystemRokCommon->processRegisteredConfigs() JROOT/plugins/system/rokcommon/rokcommon.php:75 7 plgSystemRokCommon->__construct() JROOT/libraries/src/Plugin/PluginHelper.php:280 6 Joomla\CMS\Plugin\PluginHelper::import() JROOT/libraries/src/Plugin/PluginHelper.php:182 5 Joomla\CMS\Plugin\PluginHelper::importPlugin() JROOT/libraries/src/Application/CMSApplication.php:667 4 Joomla\CMS\Application\CMSApplication->initialiseApp() JROOT/libraries/src/Application/SiteApplication.php:686 3 Joomla\CMS\Application\SiteApplication->initialiseApp() JROOT/libraries/src/Application/SiteApplication.php:212 2 Joomla\CMS\Application\SiteApplication->doExecute() JROOT/libraries/src/Application/CMSApplication.php:225 1 Joomla\CMS\Application\CMSApplication->execute() JROOT/index.php:49 - Query Time: 0.98 ms After last query: 60.52 ms Query memory: 0.006 MB Memory before query: 12.411 MB Rows returned: 69
SELECT *
FROM w0v41_rsform_configid select_type table partitions type possible_keys key key_len ref rows filtered Extra 1 SIMPLE w0v41_rsform_config NULL ALL NULL NO INDEX KEY COULD BE USED NULL NULL 69 100.00 NULL No SHOW PROFILE (maybe because there are more than 100 queries)# Caller File and line number 13 JDatabaseDriverMysqli->execute() JROOT/libraries/joomla/database/driver.php:1701 12 JDatabaseDriver->loadObjectList() JROOT/administrator/components/com_rsform/helpers/config.php:50 11 RSFormProConfig->load() JROOT/administrator/components/com_rsform/helpers/config.php:17 10 RSFormProConfig->__construct() JROOT/administrator/components/com_rsform/helpers/config.php:102 9 RSFormProConfig::getInstance() JROOT/plugins/system/rsformdeletesubmissions/rsformdeletesubmissions.php:28 8 plgSystemRsformdeletesubmissions->onAfterInitialise() JROOT/libraries/joomla/event/event.php:70 7 JEvent->update() JROOT/libraries/joomla/event/dispatcher.php:160 6 JEventDispatcher->trigger() JROOT/libraries/src/Application/BaseApplication.php:108 5 Joomla\CMS\Application\BaseApplication->triggerEvent() JROOT/libraries/src/Application/CMSApplication.php:668 4 Joomla\CMS\Application\CMSApplication->initialiseApp() JROOT/libraries/src/Application/SiteApplication.php:686 3 Joomla\CMS\Application\SiteApplication->initialiseApp() JROOT/libraries/src/Application/SiteApplication.php:212 2 Joomla\CMS\Application\SiteApplication->doExecute() JROOT/libraries/src/Application/CMSApplication.php:225 1 Joomla\CMS\Application\CMSApplication->execute() JROOT/index.php:49 - Query Time: 2.18 ms After last query: 3.29 ms Query memory: 0.007 MB Memory before query: 12.655 MB Rows returned: 20
SHOW FULL COLUMNS
FROM `w0v41_extensions`EXPLAIN not possible on query: SHOW FULL COLUMNS FROM `w0v41_extensions`No SHOW PROFILE (maybe because there are more than 100 queries)# Caller File and line number 15 JDatabaseDriverMysqli->execute() JROOT/libraries/joomla/database/driver.php:1701 14 JDatabaseDriver->loadObjectList() JROOT/libraries/joomla/database/driver/mysqli.php:448 13 JDatabaseDriverMysqli->getTableColumns() JROOT/libraries/src/Table/Table.php:261 12 Joomla\CMS\Table\Table->getFields() JROOT/libraries/src/Table/Table.php:180 11 Joomla\CMS\Table\Table->__construct() JROOT/libraries/src/Table/Extension.php:32 10 Joomla\CMS\Table\Extension->__construct() JROOT/libraries/src/Table/Table.php:328 9 Joomla\CMS\Table\Table::getInstance() JROOT/plugins/system/roksprocket/roksprocket.php:45 8 plgSystemRokSprocket->onAfterInitialise() JROOT/libraries/joomla/event/event.php:70 7 JEvent->update() JROOT/libraries/joomla/event/dispatcher.php:160 6 JEventDispatcher->trigger() JROOT/libraries/src/Application/BaseApplication.php:108 5 Joomla\CMS\Application\BaseApplication->triggerEvent() JROOT/libraries/src/Application/CMSApplication.php:668 4 Joomla\CMS\Application\CMSApplication->initialiseApp() JROOT/libraries/src/Application/SiteApplication.php:686 3 Joomla\CMS\Application\SiteApplication->initialiseApp() JROOT/libraries/src/Application/SiteApplication.php:212 2 Joomla\CMS\Application\SiteApplication->doExecute() JROOT/libraries/src/Application/CMSApplication.php:225 1 Joomla\CMS\Application\CMSApplication->execute() JROOT/index.php:49 - Query Time: 0.39 ms After last query: 1.57 ms Query memory: 0.005 MB Memory before query: 12.709 MB Rows returned: 1
SELECT `extension_id`
FROM `w0v41_extensions`
WHERE type = 'component'
AND element = 'com_roksprocket'id select_type table partitions type possible_keys key key_len ref rows filtered Extra 1 SIMPLE w0v41_extensions NULL ref element_clientid,element_folder_clientid,extension extension 484 const,const 1 100.00 Using index No SHOW PROFILE (maybe because there are more than 100 queries)# Caller File and line number 11 JDatabaseDriverMysqli->execute() JROOT/libraries/joomla/database/driver.php:1740 10 JDatabaseDriver->loadResult() JROOT/libraries/src/Table/Extension.php:124 9 Joomla\CMS\Table\Extension->find() JROOT/plugins/system/roksprocket/roksprocket.php:47 8 plgSystemRokSprocket->onAfterInitialise() JROOT/libraries/joomla/event/event.php:70 7 JEvent->update() JROOT/libraries/joomla/event/dispatcher.php:160 6 JEventDispatcher->trigger() JROOT/libraries/src/Application/BaseApplication.php:108 5 Joomla\CMS\Application\BaseApplication->triggerEvent() JROOT/libraries/src/Application/CMSApplication.php:668 4 Joomla\CMS\Application\CMSApplication->initialiseApp() JROOT/libraries/src/Application/SiteApplication.php:686 3 Joomla\CMS\Application\SiteApplication->initialiseApp() JROOT/libraries/src/Application/SiteApplication.php:212 2 Joomla\CMS\Application\SiteApplication->doExecute() JROOT/libraries/src/Application/CMSApplication.php:225 1 Joomla\CMS\Application\CMSApplication->execute() JROOT/index.php:49 - Query Time: 0.34 ms After last query: 0.09 ms Query memory: 0.005 MB Memory before query: 12.715 MB Rows returned: 1Duplicate queries: #14
SELECT *
FROM w0v41_extensions
WHERE `extension_id` = '10274'id select_type table partitions type possible_keys key key_len ref rows filtered Extra 1 SIMPLE w0v41_extensions NULL const PRIMARY PRIMARY 4 const 1 100.00 NULL No SHOW PROFILE (maybe because there are more than 100 queries)# Caller File and line number 11 JDatabaseDriverMysqli->execute() JROOT/libraries/joomla/database/driver.php:1465 10 JDatabaseDriver->loadAssoc() JROOT/libraries/src/Table/Table.php:747 9 Joomla\CMS\Table\Table->load() JROOT/plugins/system/roksprocket/roksprocket.php:54 8 plgSystemRokSprocket->onAfterInitialise() JROOT/libraries/joomla/event/event.php:70 7 JEvent->update() JROOT/libraries/joomla/event/dispatcher.php:160 6 JEventDispatcher->trigger() JROOT/libraries/src/Application/BaseApplication.php:108 5 Joomla\CMS\Application\BaseApplication->triggerEvent() JROOT/libraries/src/Application/CMSApplication.php:668 4 Joomla\CMS\Application\CMSApplication->initialiseApp() JROOT/libraries/src/Application/SiteApplication.php:686 3 Joomla\CMS\Application\SiteApplication->initialiseApp() JROOT/libraries/src/Application/SiteApplication.php:212 2 Joomla\CMS\Application\SiteApplication->doExecute() JROOT/libraries/src/Application/CMSApplication.php:225 1 Joomla\CMS\Application\CMSApplication->execute() JROOT/index.php:49 - Query Time: 0.34 ms After last query: 0.09 ms Query memory: 0.005 MB Memory before query: 12.720 MB Rows returned: 1
SELECT `extension_id`
FROM `w0v41_extensions`
WHERE type = 'module'
AND element = 'mod_roksprocket'id select_type table partitions type possible_keys key key_len ref rows filtered Extra 1 SIMPLE w0v41_extensions NULL ref element_clientid,element_folder_clientid,extension extension 484 const,const 1 100.00 Using index No SHOW PROFILE (maybe because there are more than 100 queries)# Caller File and line number 11 JDatabaseDriverMysqli->execute() JROOT/libraries/joomla/database/driver.php:1740 10 JDatabaseDriver->loadResult() JROOT/libraries/src/Table/Extension.php:124 9 Joomla\CMS\Table\Extension->find() JROOT/plugins/system/roksprocket/roksprocket.php:70 8 plgSystemRokSprocket->onAfterInitialise() JROOT/libraries/joomla/event/event.php:70 7 JEvent->update() JROOT/libraries/joomla/event/dispatcher.php:160 6 JEventDispatcher->trigger() JROOT/libraries/src/Application/BaseApplication.php:108 5 Joomla\CMS\Application\BaseApplication->triggerEvent() JROOT/libraries/src/Application/CMSApplication.php:668 4 Joomla\CMS\Application\CMSApplication->initialiseApp() JROOT/libraries/src/Application/SiteApplication.php:686 3 Joomla\CMS\Application\SiteApplication->initialiseApp() JROOT/libraries/src/Application/SiteApplication.php:212 2 Joomla\CMS\Application\SiteApplication->doExecute() JROOT/libraries/src/Application/CMSApplication.php:225 1 Joomla\CMS\Application\CMSApplication->execute() JROOT/index.php:49 - Query Time: 0.30 ms After last query: 0.07 ms Query memory: 0.005 MB Memory before query: 12.726 MB Rows returned: 1Duplicate queries: #12
SELECT *
FROM w0v41_extensions
WHERE `extension_id` = '10274'id select_type table partitions type possible_keys key key_len ref rows filtered Extra 1 SIMPLE w0v41_extensions NULL const PRIMARY PRIMARY 4 const 1 100.00 NULL No SHOW PROFILE (maybe because there are more than 100 queries)# Caller File and line number 11 JDatabaseDriverMysqli->execute() JROOT/libraries/joomla/database/driver.php:1465 10 JDatabaseDriver->loadAssoc() JROOT/libraries/src/Table/Table.php:747 9 Joomla\CMS\Table\Table->load() JROOT/plugins/system/roksprocket/roksprocket.php:76 8 plgSystemRokSprocket->onAfterInitialise() JROOT/libraries/joomla/event/event.php:70 7 JEvent->update() JROOT/libraries/joomla/event/dispatcher.php:160 6 JEventDispatcher->trigger() JROOT/libraries/src/Application/BaseApplication.php:108 5 Joomla\CMS\Application\BaseApplication->triggerEvent() JROOT/libraries/src/Application/CMSApplication.php:668 4 Joomla\CMS\Application\CMSApplication->initialiseApp() JROOT/libraries/src/Application/SiteApplication.php:686 3 Joomla\CMS\Application\SiteApplication->initialiseApp() JROOT/libraries/src/Application/SiteApplication.php:212 2 Joomla\CMS\Application\SiteApplication->doExecute() JROOT/libraries/src/Application/CMSApplication.php:225 1 Joomla\CMS\Application\CMSApplication->execute() JROOT/index.php:49 - Query Time: 0.83 ms After last query: 203.67 ms Query memory: 0.006 MB Memory before query: 16.931 MB
UPDATE `w0v41_extensions`
SET `params` = '{\"mediaversion\":\"8750cfe38c60672549245d1ab9ead606\"}'
WHERE `type` = 'library'
AND `element` = 'joomla'EXPLAIN not possible on query: UPDATE `w0v41_extensions` SET `params` = '{\"mediaversion\":\"8750cfe38c60672549245d1ab9ead606\"}' WHERE `type` = 'library' AND `element` = 'joomla'No SHOW PROFILE (maybe because there are more than 100 queries)# Caller File and line number 14 JDatabaseDriverMysqli->execute() JROOT/libraries/src/Helper/LibraryHelper.php:117 13 Joomla\CMS\Helper\LibraryHelper::saveParams() JROOT/libraries/src/Version.php:372 12 Joomla\CMS\Version->setMediaVersion() JROOT/libraries/src/Version.php:331 11 Joomla\CMS\Version->getMediaVersion() JROOT/libraries/src/Factory.php:778 10 Joomla\CMS\Factory::createDocument() JROOT/libraries/src/Factory.php:234 9 Joomla\CMS\Factory::getDocument() JROOT/plugins/system/k2/k2.php:374 8 plgSystemK2->onAfterRoute() JROOT/libraries/joomla/event/event.php:70 7 JEvent->update() JROOT/libraries/joomla/event/dispatcher.php:160 6 JEventDispatcher->trigger() JROOT/libraries/src/Application/BaseApplication.php:108 5 Joomla\CMS\Application\BaseApplication->triggerEvent() JROOT/libraries/src/Application/CMSApplication.php:1190 4 Joomla\CMS\Application\CMSApplication->route() JROOT/libraries/src/Application/SiteApplication.php:796 3 Joomla\CMS\Application\SiteApplication->route() JROOT/libraries/src/Application/SiteApplication.php:218 2 Joomla\CMS\Application\SiteApplication->doExecute() JROOT/libraries/src/Application/CMSApplication.php:225 1 Joomla\CMS\Application\CMSApplication->execute() JROOT/index.php:49 - Query Time: 1.20 ms After last query: 14.63 ms Query memory: 0.006 MB Memory before query: 17.708 MB Rows returned: 60
SELECT `id`,`name`,`rules`,`parent_id`
FROM `w0v41_assets`
WHERE `name` IN ('root.1','com_actionlogs','com_acym','com_acymailing','com_admin','com_adminmenumanager','com_advportfoliopro','com_ajax','com_akeeba','com_associations','com_banners','com_bdthemes_shortcodes','com_cache','com_categories','com_checkin','com_cjlib','com_config','com_contact','com_content','com_contenthistory','com_cpanel','com_eventgallery','com_extplorer','com_fields','com_finder','com_installer','com_jce','com_jmap','com_joominapayments','com_joomlaupdate','com_k2','com_languages','com_login','com_mailto','com_media','com_menus','com_messages','com_modules','com_newsfeeds','com_plugins','com_postinstall','com_privacy','com_profiles','com_redirect','com_roksprocket','com_rsform','com_search','com_sigpro','com_smartcountdown3','com_speventum','com_splms','com_spmedical','com_sppagebuilder','com_spsimpleportfolio','com_tags','com_teamchart','com_templates','com_tinypayment','com_uniterevolution2','com_users','com_wrapper')id select_type table partitions type possible_keys key key_len ref rows filtered Extra 1 SIMPLE w0v41_assets NULL range idx_asset_name idx_asset_name 202 NULL 61 100.00 Using index condition No SHOW PROFILE (maybe because there are more than 100 queries)# Caller File and line number 13 JDatabaseDriverMysqli->execute() JROOT/libraries/joomla/database/driver.php:1701 12 JDatabaseDriver->loadObjectList() JROOT/libraries/src/Access/Access.php:429 11 Joomla\CMS\Access\Access::preloadComponents() JROOT/libraries/src/Access/Access.php:213 10 Joomla\CMS\Access\Access::preload() JROOT/libraries/src/Access/Access.php:531 9 Joomla\CMS\Access\Access::getAssetRules() JROOT/libraries/src/Access/Access.php:183 8 Joomla\CMS\Access\Access::check() JROOT/libraries/src/User/User.php:398 7 Joomla\CMS\User\User->authorise() JROOT/components/com_k2/k2.php:15 6 require_once JROOT/components/com_k2/k2.php JROOT/libraries/src/Component/ComponentHelper.php:402 5 Joomla\CMS\Component\ComponentHelper::executeComponent() JROOT/libraries/src/Component/ComponentHelper.php:377 4 Joomla\CMS\Component\ComponentHelper::renderComponent() JROOT/libraries/src/Application/SiteApplication.php:194 3 Joomla\CMS\Application\SiteApplication->dispatch() JROOT/libraries/src/Application/SiteApplication.php:233 2 Joomla\CMS\Application\SiteApplication->doExecute() JROOT/libraries/src/Application/CMSApplication.php:225 1 Joomla\CMS\Application\CMSApplication->execute() JROOT/index.php:49 - Query Time: 0.57 ms After last query: 20.38 ms Query memory: 0.009 MB Memory before query: 19.185 MB Rows returned: 1
SELECT enabled
FROM w0v41_extensions
WHERE element = 'com_sppagebuilder'
AND type = 'component'id select_type table partitions type possible_keys key key_len ref rows filtered Extra 1 SIMPLE w0v41_extensions NULL ref element_clientid,element_folder_clientid,extension element_clientid 402 const 1 10.00 Using where No SHOW PROFILE (maybe because there are more than 100 queries)# Caller File and line number 18 JDatabaseDriverMysqli->execute() JROOT/libraries/joomla/database/driver.php:1740 17 JDatabaseDriver->loadResult() JROOT/plugins/content/sppagebuilder/sppagebuilder.php:172 16 PlgContentSppagebuilder->isSppagebuilderEnabled() JROOT/plugins/content/sppagebuilder/sppagebuilder.php:36 15 PlgContentSppagebuilder->__construct() JROOT/libraries/src/Plugin/PluginHelper.php:280 14 Joomla\CMS\Plugin\PluginHelper::import() JROOT/libraries/src/Plugin/PluginHelper.php:182 13 Joomla\CMS\Plugin\PluginHelper::importPlugin() JROOT/components/com_k2/views/itemlist/view.html.php:65 12 K2ViewItemlist->display() JROOT/libraries/src/Cache/Controller/ViewController.php:102 11 Joomla\CMS\Cache\Controller\ViewController->get() JROOT/libraries/src/MVC/Controller/BaseController.php:655 10 Joomla\CMS\MVC\Controller\BaseController->display() JROOT/components/com_k2/controllers/controller.php:20 9 K2Controller->display() JROOT/components/com_k2/controllers/itemlist.php:50 8 K2ControllerItemlist->display() JROOT/libraries/src/MVC/Controller/BaseController.php:702 7 Joomla\CMS\MVC\Controller\BaseController->execute() JROOT/components/com_k2/k2.php:57 6 require_once JROOT/components/com_k2/k2.php JROOT/libraries/src/Component/ComponentHelper.php:402 5 Joomla\CMS\Component\ComponentHelper::executeComponent() JROOT/libraries/src/Component/ComponentHelper.php:377 4 Joomla\CMS\Component\ComponentHelper::renderComponent() JROOT/libraries/src/Application/SiteApplication.php:194 3 Joomla\CMS\Application\SiteApplication->dispatch() JROOT/libraries/src/Application/SiteApplication.php:233 2 Joomla\CMS\Application\SiteApplication->doExecute() JROOT/libraries/src/Application/CMSApplication.php:225 1 Joomla\CMS\Application\CMSApplication->execute() JROOT/index.php:49 - Query Time: 0.78 ms After last query: 5.11 ms Query memory: 0.007 MB Memory before query: 19.492 MB Rows returned: 0
SELECT id
FROM w0v41_k2_categories
WHERE parent IN(2,3)
AND id NOT IN(2,3)
AND published=1
AND trash=0
AND access IN(1,1,5)
AND language IN('en-GB', '*')id select_type table partitions type possible_keys key key_len ref rows filtered Extra 1 SIMPLE w0v41_k2_categories NULL range PRIMARY,category,parent,published,access,trash,language,idx_category PRIMARY 4 NULL 13 7.14 Using where No SHOW PROFILE (maybe because there are more than 100 queries)# Caller File and line number 16 JDatabaseDriverMysqli->execute() JROOT/libraries/joomla/database/driver.php:1550 15 JDatabaseDriver->loadColumn() JROOT/components/com_k2/models/itemlist.php:412 14 K2ModelItemlist->getCategoryTree() JROOT/components/com_k2/models/itemlist.php:257 13 K2ModelItemlist->getData() JROOT/components/com_k2/views/itemlist/view.html.php:568 12 K2ViewItemlist->display() JROOT/libraries/src/Cache/Controller/ViewController.php:102 11 Joomla\CMS\Cache\Controller\ViewController->get() JROOT/libraries/src/MVC/Controller/BaseController.php:655 10 Joomla\CMS\MVC\Controller\BaseController->display() JROOT/components/com_k2/controllers/controller.php:20 9 K2Controller->display() JROOT/components/com_k2/controllers/itemlist.php:50 8 K2ControllerItemlist->display() JROOT/libraries/src/MVC/Controller/BaseController.php:702 7 Joomla\CMS\MVC\Controller\BaseController->execute() JROOT/components/com_k2/k2.php:57 6 require_once JROOT/components/com_k2/k2.php JROOT/libraries/src/Component/ComponentHelper.php:402 5 Joomla\CMS\Component\ComponentHelper::executeComponent() JROOT/libraries/src/Component/ComponentHelper.php:377 4 Joomla\CMS\Component\ComponentHelper::renderComponent() JROOT/libraries/src/Application/SiteApplication.php:194 3 Joomla\CMS\Application\SiteApplication->dispatch() JROOT/libraries/src/Application/SiteApplication.php:233 2 Joomla\CMS\Application\SiteApplication->doExecute() JROOT/libraries/src/Application/CMSApplication.php:225 1 Joomla\CMS\Application\CMSApplication->execute() JROOT/index.php:49 - Query Time: 3.85 ms After last query: 0.06 ms Query memory: 0.007 MB Memory before query: 19.501 MB Rows returned: 5
/* Frontend / K2 / Items */ SELECT /*+ MAX_EXECUTION_TIME(60000) */ SQL_CALC_FOUND_ROWS i.*, c.name AS categoryname, c.id AS categoryid, c.alias AS categoryalias, c.params AS categoryparams
FROM w0v41_k2_items AS i
INNER JOIN w0v41_k2_categories AS c USE INDEX (idx_category)
ON c.id = i.catid
WHERE i.published = 1
AND i.access IN(1,5)
AND i.trash = 0
AND c.published = 1
AND c.access IN(1,5)
AND c.trash = 0
AND c.language IN('en-GB', '*')
AND i.language IN('en-GB', '*')
AND (i.publish_up = '0000-00-00 00:00:00' OR i.publish_up <= '2025-08-29 16:29:05')
AND (i.publish_down = '0000-00-00 00:00:00' OR i.publish_down >= '2025-08-29 16:29:05')
AND c.id IN(2,3)
ORDER BY i.id DESC
LIMIT 0, 7EXPLAIN not possible on query: /* Frontend / K2 / Items */ SELECT /*+ MAX_EXECUTION_TIME(60000) */ SQL_CALC_FOUND_ROWS i.*, c.name AS categoryname, c.id AS categoryid, c.alias AS categoryalias, c.params AS categoryparams FROM w0v41_k2_items AS i INNER JOIN w0v41_k2_categories AS c USE INDEX (idx_category) ON c.id = i.catid WHERE i.published = 1 AND i.access IN(1,5) AND i.trash = 0 AND c.published = 1 AND c.access IN(1,5) AND c.trash = 0 AND c.language IN('en-GB', '*') AND i.language IN('en-GB', '*') AND (i.publish_up = '0000-00-00 00:00:00' OR i.publish_up <= '2025-08-29 16:29:05') AND (i.publish_down = '0000-00-00 00:00:00' OR i.publish_down >= '2025-08-29 16:29:05') AND c.id IN(2,3) ORDER BY i.id DESC LIMIT 0, 7No SHOW PROFILE (maybe because there are more than 100 queries)# Caller File and line number 15 JDatabaseDriverMysqli->execute() JROOT/libraries/joomla/database/driver.php:1701 14 JDatabaseDriver->loadObjectList() JROOT/components/com_k2/models/itemlist.php:352 13 K2ModelItemlist->getData() JROOT/components/com_k2/views/itemlist/view.html.php:568 12 K2ViewItemlist->display() JROOT/libraries/src/Cache/Controller/ViewController.php:102 11 Joomla\CMS\Cache\Controller\ViewController->get() JROOT/libraries/src/MVC/Controller/BaseController.php:655 10 Joomla\CMS\MVC\Controller\BaseController->display() JROOT/components/com_k2/controllers/controller.php:20 9 K2Controller->display() JROOT/components/com_k2/controllers/itemlist.php:50 8 K2ControllerItemlist->display() JROOT/libraries/src/MVC/Controller/BaseController.php:702 7 Joomla\CMS\MVC\Controller\BaseController->execute() JROOT/components/com_k2/k2.php:57 6 require_once JROOT/components/com_k2/k2.php JROOT/libraries/src/Component/ComponentHelper.php:402 5 Joomla\CMS\Component\ComponentHelper::executeComponent() JROOT/libraries/src/Component/ComponentHelper.php:377 4 Joomla\CMS\Component\ComponentHelper::renderComponent() JROOT/libraries/src/Application/SiteApplication.php:194 3 Joomla\CMS\Application\SiteApplication->dispatch() JROOT/libraries/src/Application/SiteApplication.php:233 2 Joomla\CMS\Application\SiteApplication->doExecute() JROOT/libraries/src/Application/CMSApplication.php:225 1 Joomla\CMS\Application\CMSApplication->execute() JROOT/index.php:49 - Query Time: 0.17 ms After last query: 0.15 ms Query memory: 0.007 MB Memory before query: 19.731 MB Rows returned: 1
SELECT FOUND_ROWS();
id select_type table partitions type possible_keys key key_len ref rows filtered Extra 1 SIMPLE NULL NULL NULL NULL NO INDEX KEY COULD BE USED NULL NULL NULL NULL No tables used No SHOW PROFILE (maybe because there are more than 100 queries)# Caller File and line number 15 JDatabaseDriverMysqli->execute() JROOT/libraries/joomla/database/driver.php:1740 14 JDatabaseDriver->loadResult() JROOT/components/com_k2/models/itemlist.php:365 13 K2ModelItemlist->getData() JROOT/components/com_k2/views/itemlist/view.html.php:568 12 K2ViewItemlist->display() JROOT/libraries/src/Cache/Controller/ViewController.php:102 11 Joomla\CMS\Cache\Controller\ViewController->get() JROOT/libraries/src/MVC/Controller/BaseController.php:655 10 Joomla\CMS\MVC\Controller\BaseController->display() JROOT/components/com_k2/controllers/controller.php:20 9 K2Controller->display() JROOT/components/com_k2/controllers/itemlist.php:50 8 K2ControllerItemlist->display() JROOT/libraries/src/MVC/Controller/BaseController.php:702 7 Joomla\CMS\MVC\Controller\BaseController->execute() JROOT/components/com_k2/k2.php:57 6 require_once JROOT/components/com_k2/k2.php JROOT/libraries/src/Component/ComponentHelper.php:402 5 Joomla\CMS\Component\ComponentHelper::executeComponent() JROOT/libraries/src/Component/ComponentHelper.php:377 4 Joomla\CMS\Component\ComponentHelper::renderComponent() JROOT/libraries/src/Application/SiteApplication.php:194 3 Joomla\CMS\Application\SiteApplication->dispatch() JROOT/libraries/src/Application/SiteApplication.php:233 2 Joomla\CMS\Application\SiteApplication->doExecute() JROOT/libraries/src/Application/CMSApplication.php:225 1 Joomla\CMS\Application\CMSApplication->execute() JROOT/index.php:49 - Query Time: 1.29 ms After last query: 2.17 ms Query memory: 0.009 MB Memory before query: 19.852 MB Rows returned: 14
SHOW FULL COLUMNS
FROM `w0v41_k2_categories`EXPLAIN not possible on query: SHOW FULL COLUMNS FROM `w0v41_k2_categories`No SHOW PROFILE (maybe because there are more than 100 queries)# Caller File and line number 19 JDatabaseDriverMysqli->execute() JROOT/libraries/joomla/database/driver.php:1701 18 JDatabaseDriver->loadObjectList() JROOT/libraries/joomla/database/driver/mysqli.php:448 17 JDatabaseDriverMysqli->getTableColumns() JROOT/libraries/src/Table/Table.php:261 16 Joomla\CMS\Table\Table->getFields() JROOT/libraries/src/Table/Table.php:180 15 Joomla\CMS\Table\Table->__construct() JROOT/administrator/components/com_k2/tables/k2category.php:34 14 TableK2Category->__construct() JROOT/libraries/src/Table/Table.php:328 13 Joomla\CMS\Table\Table::getInstance() JROOT/components/com_k2/views/itemlist/view.html.php:693 12 K2ViewItemlist->display() JROOT/libraries/src/Cache/Controller/ViewController.php:102 11 Joomla\CMS\Cache\Controller\ViewController->get() JROOT/libraries/src/MVC/Controller/BaseController.php:655 10 Joomla\CMS\MVC\Controller\BaseController->display() JROOT/components/com_k2/controllers/controller.php:20 9 K2Controller->display() JROOT/components/com_k2/controllers/itemlist.php:50 8 K2ControllerItemlist->display() JROOT/libraries/src/MVC/Controller/BaseController.php:702 7 Joomla\CMS\MVC\Controller\BaseController->execute() JROOT/components/com_k2/k2.php:57 6 require_once JROOT/components/com_k2/k2.php JROOT/libraries/src/Component/ComponentHelper.php:402 5 Joomla\CMS\Component\ComponentHelper::executeComponent() JROOT/libraries/src/Component/ComponentHelper.php:377 4 Joomla\CMS\Component\ComponentHelper::renderComponent() JROOT/libraries/src/Application/SiteApplication.php:194 3 Joomla\CMS\Application\SiteApplication->dispatch() JROOT/libraries/src/Application/SiteApplication.php:233 2 Joomla\CMS\Application\SiteApplication->doExecute() JROOT/libraries/src/Application/CMSApplication.php:225 1 Joomla\CMS\Application\CMSApplication->execute() JROOT/index.php:49 - Query Time: 0.28 ms After last query: 0.89 ms Query memory: 0.009 MB Memory before query: 19.900 MB Rows returned: 1
SELECT *
FROM w0v41_k2_categories
WHERE id = '3'id select_type table partitions type possible_keys key key_len ref rows filtered Extra 1 SIMPLE w0v41_k2_categories NULL const PRIMARY PRIMARY 4 const 1 100.00 NULL No SHOW PROFILE (maybe because there are more than 100 queries)# Caller File and line number 19 JDatabaseDriverMysqli->execute() JROOT/libraries/joomla/database/driver.php:1465 18 JDatabaseDriver->loadAssoc() JROOT/administrator/components/com_k2/tables/k2category.php:61 17 TableK2Category->load() JROOT/components/com_k2/models/item.php:65 16 K2ModelItem->prepareItem() Same as call in the line below. 15 call_user_func_array() JROOT/libraries/src/Cache/Controller/CallbackController.php:173 14 Joomla\CMS\Cache\Controller\CallbackController->get() JROOT/libraries/src/Cache/Controller/CallbackController.php:45 13 Joomla\CMS\Cache\Controller\CallbackController->call() JROOT/components/com_k2/views/itemlist/view.html.php:695 12 K2ViewItemlist->display() JROOT/libraries/src/Cache/Controller/ViewController.php:102 11 Joomla\CMS\Cache\Controller\ViewController->get() JROOT/libraries/src/MVC/Controller/BaseController.php:655 10 Joomla\CMS\MVC\Controller\BaseController->display() JROOT/components/com_k2/controllers/controller.php:20 9 K2Controller->display() JROOT/components/com_k2/controllers/itemlist.php:50 8 K2ControllerItemlist->display() JROOT/libraries/src/MVC/Controller/BaseController.php:702 7 Joomla\CMS\MVC\Controller\BaseController->execute() JROOT/components/com_k2/k2.php:57 6 require_once JROOT/components/com_k2/k2.php JROOT/libraries/src/Component/ComponentHelper.php:402 5 Joomla\CMS\Component\ComponentHelper::executeComponent() JROOT/libraries/src/Component/ComponentHelper.php:377 4 Joomla\CMS\Component\ComponentHelper::renderComponent() JROOT/libraries/src/Application/SiteApplication.php:194 3 Joomla\CMS\Application\SiteApplication->dispatch() JROOT/libraries/src/Application/SiteApplication.php:233 2 Joomla\CMS\Application\SiteApplication->doExecute() JROOT/libraries/src/Application/CMSApplication.php:225 1 Joomla\CMS\Application\CMSApplication->execute() JROOT/index.php:49 - Query Time: 0.25 ms After last query: 1.43 ms Query memory: 0.012 MB Memory before query: 19.945 MB Rows returned: 1
SELECT id, alias, parent
FROM w0v41_k2_categories
WHERE published = 1
AND id = 3id select_type table partitions type possible_keys key key_len ref rows filtered Extra 1 SIMPLE w0v41_k2_categories NULL const PRIMARY,category,published,idx_category PRIMARY 4 const 1 100.00 NULL No SHOW PROFILE (maybe because there are more than 100 queries)# Caller File and line number 28 JDatabaseDriverMysqli->execute() JROOT/libraries/joomla/database/driver.php:1662 27 JDatabaseDriver->loadObject() JROOT/components/com_k2/router.php:493 26 getCategoryProps() JROOT/components/com_k2/router.php:501 25 getCategoryPath() JROOT/components/com_k2/router.php:205 24 k2BuildRoute() JROOT/libraries/src/Component/Router/RouterLegacy.php:69 23 Joomla\CMS\Component\Router\RouterLegacy->build() JROOT/libraries/src/Router/SiteRouter.php:532 22 Joomla\CMS\Router\SiteRouter->buildSefRoute() JROOT/libraries/src/Router/SiteRouter.php:502 21 Joomla\CMS\Router\SiteRouter->_buildSefRoute() JROOT/libraries/src/Router/Router.php:281 20 Joomla\CMS\Router\Router->build() JROOT/libraries/src/Router/SiteRouter.php:155 19 Joomla\CMS\Router\SiteRouter->build() JROOT/libraries/src/Router/Route.php:144 18 Joomla\CMS\Router\Route::link() JROOT/libraries/src/Router/Route.php:93 17 Joomla\CMS\Router\Route::_() JROOT/components/com_k2/models/item.php:68 16 K2ModelItem->prepareItem() Same as call in the line below. 15 call_user_func_array() JROOT/libraries/src/Cache/Controller/CallbackController.php:173 14 Joomla\CMS\Cache\Controller\CallbackController->get() JROOT/libraries/src/Cache/Controller/CallbackController.php:45 13 Joomla\CMS\Cache\Controller\CallbackController->call() JROOT/components/com_k2/views/itemlist/view.html.php:695 12 K2ViewItemlist->display() JROOT/libraries/src/Cache/Controller/ViewController.php:102 11 Joomla\CMS\Cache\Controller\ViewController->get() JROOT/libraries/src/MVC/Controller/BaseController.php:655 10 Joomla\CMS\MVC\Controller\BaseController->display() JROOT/components/com_k2/controllers/controller.php:20 9 K2Controller->display() JROOT/components/com_k2/controllers/itemlist.php:50 8 K2ControllerItemlist->display() JROOT/libraries/src/MVC/Controller/BaseController.php:702 7 Joomla\CMS\MVC\Controller\BaseController->execute() JROOT/components/com_k2/k2.php:57 6 require_once JROOT/components/com_k2/k2.php JROOT/libraries/src/Component/ComponentHelper.php:402 5 Joomla\CMS\Component\ComponentHelper::executeComponent() JROOT/libraries/src/Component/ComponentHelper.php:377 4 Joomla\CMS\Component\ComponentHelper::renderComponent() JROOT/libraries/src/Application/SiteApplication.php:194 3 Joomla\CMS\Application\SiteApplication->dispatch() JROOT/libraries/src/Application/SiteApplication.php:233 2 Joomla\CMS\Application\SiteApplication->doExecute() JROOT/libraries/src/Application/CMSApplication.php:225 1 Joomla\CMS\Application\CMSApplication->execute() JROOT/index.php:49 - Query Time: 1.68 ms After last query: 0.99 ms Query memory: 0.009 MB Memory before query: 20.010 MB Rows returned: 1
SELECT tag.*
FROM w0v41_k2_tags AS tag JOIN w0v41_k2_tags_xref AS xref
ON tag.id = xref.tagID
WHERE tag.published = 1
AND xref.itemID = 13
ORDER BY xref.id ASCid select_type table partitions type possible_keys key key_len ref rows filtered Extra 1 SIMPLE xref NULL ref tagID,itemID itemID 4 const 1 100.00 NULL 1 SIMPLE tag NULL eq_ref PRIMARY,published PRIMARY 4 h88876_SDAT.xref.tagID 1 100.00 Using where No SHOW PROFILE (maybe because there are more than 100 queries)# Caller File and line number 19 JDatabaseDriverMysqli->execute() JROOT/libraries/joomla/database/driver.php:1701 18 JDatabaseDriver->loadObjectList() JROOT/components/com_k2/models/item.php:1201 17 K2ModelItem->getItemTags() JROOT/components/com_k2/models/item.php:111 16 K2ModelItem->prepareItem() Same as call in the line below. 15 call_user_func_array() JROOT/libraries/src/Cache/Controller/CallbackController.php:173 14 Joomla\CMS\Cache\Controller\CallbackController->get() JROOT/libraries/src/Cache/Controller/CallbackController.php:45 13 Joomla\CMS\Cache\Controller\CallbackController->call() JROOT/components/com_k2/views/itemlist/view.html.php:695 12 K2ViewItemlist->display() JROOT/libraries/src/Cache/Controller/ViewController.php:102 11 Joomla\CMS\Cache\Controller\ViewController->get() JROOT/libraries/src/MVC/Controller/BaseController.php:655 10 Joomla\CMS\MVC\Controller\BaseController->display() JROOT/components/com_k2/controllers/controller.php:20 9 K2Controller->display() JROOT/components/com_k2/controllers/itemlist.php:50 8 K2ControllerItemlist->display() JROOT/libraries/src/MVC/Controller/BaseController.php:702 7 Joomla\CMS\MVC\Controller\BaseController->execute() JROOT/components/com_k2/k2.php:57 6 require_once JROOT/components/com_k2/k2.php JROOT/libraries/src/Component/ComponentHelper.php:402 5 Joomla\CMS\Component\ComponentHelper::executeComponent() JROOT/libraries/src/Component/ComponentHelper.php:377 4 Joomla\CMS\Component\ComponentHelper::renderComponent() JROOT/libraries/src/Application/SiteApplication.php:194 3 Joomla\CMS\Application\SiteApplication->dispatch() JROOT/libraries/src/Application/SiteApplication.php:233 2 Joomla\CMS\Application\SiteApplication->doExecute() JROOT/libraries/src/Application/CMSApplication.php:225 1 Joomla\CMS\Application\CMSApplication->execute() JROOT/index.php:49 - Query Time: 1.21 ms After last query: 1.21 ms Query memory: 0.012 MB Memory before query: 20.087 MB Rows returned: 17
SHOW FULL COLUMNS
FROM `w0v41_users`EXPLAIN not possible on query: SHOW FULL COLUMNS FROM `w0v41_users`No SHOW PROFILE (maybe because there are more than 100 queries)# Caller File and line number 28 JDatabaseDriverMysqli->execute() JROOT/libraries/joomla/database/driver.php:1701 27 JDatabaseDriver->loadObjectList() JROOT/libraries/joomla/database/driver/mysqli.php:448 26 JDatabaseDriverMysqli->getTableColumns() JROOT/libraries/src/Table/Table.php:261 25 Joomla\CMS\Table\Table->getFields() JROOT/libraries/src/Table/Table.php:180 24 Joomla\CMS\Table\Table->__construct() JROOT/libraries/src/Table/User.php:41 23 Joomla\CMS\Table\User->__construct() JROOT/libraries/src/Table/Table.php:328 22 Joomla\CMS\Table\Table::getInstance() JROOT/libraries/src/User/User.php:603 21 Joomla\CMS\User\User::getTable() JROOT/libraries/src/User/User.php:877 20 Joomla\CMS\User\User->load() JROOT/libraries/src/User/User.php:248 19 Joomla\CMS\User\User->__construct() JROOT/libraries/src/User/User.php:301 18 Joomla\CMS\User\User::getInstance() JROOT/libraries/src/Factory.php:266 17 Joomla\CMS\Factory::getUser() JROOT/components/com_k2/models/item.php:208 16 K2ModelItem->prepareItem() Same as call in the line below. 15 call_user_func_array() JROOT/libraries/src/Cache/Controller/CallbackController.php:173 14 Joomla\CMS\Cache\Controller\CallbackController->get() JROOT/libraries/src/Cache/Controller/CallbackController.php:45 13 Joomla\CMS\Cache\Controller\CallbackController->call() JROOT/components/com_k2/views/itemlist/view.html.php:695 12 K2ViewItemlist->display() JROOT/libraries/src/Cache/Controller/ViewController.php:102 11 Joomla\CMS\Cache\Controller\ViewController->get() JROOT/libraries/src/MVC/Controller/BaseController.php:655 10 Joomla\CMS\MVC\Controller\BaseController->display() JROOT/components/com_k2/controllers/controller.php:20 9 K2Controller->display() JROOT/components/com_k2/controllers/itemlist.php:50 8 K2ControllerItemlist->display() JROOT/libraries/src/MVC/Controller/BaseController.php:702 7 Joomla\CMS\MVC\Controller\BaseController->execute() JROOT/components/com_k2/k2.php:57 6 require_once JROOT/components/com_k2/k2.php JROOT/libraries/src/Component/ComponentHelper.php:402 5 Joomla\CMS\Component\ComponentHelper::executeComponent() JROOT/libraries/src/Component/ComponentHelper.php:377 4 Joomla\CMS\Component\ComponentHelper::renderComponent() JROOT/libraries/src/Application/SiteApplication.php:194 3 Joomla\CMS\Application\SiteApplication->dispatch() JROOT/libraries/src/Application/SiteApplication.php:233 2 Joomla\CMS\Application\SiteApplication->doExecute() JROOT/libraries/src/Application/CMSApplication.php:225 1 Joomla\CMS\Application\CMSApplication->execute() JROOT/index.php:49 - Query Time: 0.35 ms After last query: 0.09 ms Query memory: 0.010 MB Memory before query: 20.125 MB Rows returned: 1
SELECT *
FROM `w0v41_users`
WHERE `id` = 111id select_type table partitions type possible_keys key key_len ref rows filtered Extra 1 SIMPLE w0v41_users NULL const PRIMARY PRIMARY 4 const 1 100.00 NULL No SHOW PROFILE (maybe because there are more than 100 queries)# Caller File and line number 23 JDatabaseDriverMysqli->execute() JROOT/libraries/joomla/database/driver.php:1465 22 JDatabaseDriver->loadAssoc() JROOT/libraries/src/Table/User.php:87 21 Joomla\CMS\Table\User->load() JROOT/libraries/src/User/User.php:880 20 Joomla\CMS\User\User->load() JROOT/libraries/src/User/User.php:248 19 Joomla\CMS\User\User->__construct() JROOT/libraries/src/User/User.php:301 18 Joomla\CMS\User\User::getInstance() JROOT/libraries/src/Factory.php:266 17 Joomla\CMS\Factory::getUser() JROOT/components/com_k2/models/item.php:208 16 K2ModelItem->prepareItem() Same as call in the line below. 15 call_user_func_array() JROOT/libraries/src/Cache/Controller/CallbackController.php:173 14 Joomla\CMS\Cache\Controller\CallbackController->get() JROOT/libraries/src/Cache/Controller/CallbackController.php:45 13 Joomla\CMS\Cache\Controller\CallbackController->call() JROOT/components/com_k2/views/itemlist/view.html.php:695 12 K2ViewItemlist->display() JROOT/libraries/src/Cache/Controller/ViewController.php:102 11 Joomla\CMS\Cache\Controller\ViewController->get() JROOT/libraries/src/MVC/Controller/BaseController.php:655 10 Joomla\CMS\MVC\Controller\BaseController->display() JROOT/components/com_k2/controllers/controller.php:20 9 K2Controller->display() JROOT/components/com_k2/controllers/itemlist.php:50 8 K2ControllerItemlist->display() JROOT/libraries/src/MVC/Controller/BaseController.php:702 7 Joomla\CMS\MVC\Controller\BaseController->execute() JROOT/components/com_k2/k2.php:57 6 require_once JROOT/components/com_k2/k2.php JROOT/libraries/src/Component/ComponentHelper.php:402 5 Joomla\CMS\Component\ComponentHelper::executeComponent() JROOT/libraries/src/Component/ComponentHelper.php:377 4 Joomla\CMS\Component\ComponentHelper::renderComponent() JROOT/libraries/src/Application/SiteApplication.php:194 3 Joomla\CMS\Application\SiteApplication->dispatch() JROOT/libraries/src/Application/SiteApplication.php:233 2 Joomla\CMS\Application\SiteApplication->doExecute() JROOT/libraries/src/Application/CMSApplication.php:225 1 Joomla\CMS\Application\CMSApplication->execute() JROOT/index.php:49 - Query Time: 0.86 ms After last query: 3.21 ms Query memory: 0.010 MB Memory before query: 20.881 MB Rows returned: 3
SELECT `g`.`id`,`g`.`title`
FROM `w0v41_usergroups` AS g
INNER JOIN `w0v41_user_usergroup_map` AS m
ON m.group_id = g.id
WHERE `m`.`user_id` = 111id select_type table partitions type possible_keys key key_len ref rows filtered Extra 1 SIMPLE m NULL ref PRIMARY PRIMARY 4 const 3 100.00 Using index 1 SIMPLE g NULL eq_ref PRIMARY PRIMARY 4 h88876_SDAT.m.group_id 1 100.00 NULL No SHOW PROFILE (maybe because there are more than 100 queries)# Caller File and line number 23 JDatabaseDriverMysqli->execute() JROOT/libraries/joomla/database/driver.php:1506 22 JDatabaseDriver->loadAssocList() JROOT/libraries/src/Table/User.php:112 21 Joomla\CMS\Table\User->load() JROOT/libraries/src/User/User.php:880 20 Joomla\CMS\User\User->load() JROOT/libraries/src/User/User.php:248 19 Joomla\CMS\User\User->__construct() JROOT/libraries/src/User/User.php:301 18 Joomla\CMS\User\User::getInstance() JROOT/libraries/src/Factory.php:266 17 Joomla\CMS\Factory::getUser() JROOT/components/com_k2/models/item.php:208 16 K2ModelItem->prepareItem() Same as call in the line below. 15 call_user_func_array() JROOT/libraries/src/Cache/Controller/CallbackController.php:173 14 Joomla\CMS\Cache\Controller\CallbackController->get() JROOT/libraries/src/Cache/Controller/CallbackController.php:45 13 Joomla\CMS\Cache\Controller\CallbackController->call() JROOT/components/com_k2/views/itemlist/view.html.php:695 12 K2ViewItemlist->display() JROOT/libraries/src/Cache/Controller/ViewController.php:102 11 Joomla\CMS\Cache\Controller\ViewController->get() JROOT/libraries/src/MVC/Controller/BaseController.php:655 10 Joomla\CMS\MVC\Controller\BaseController->display() JROOT/components/com_k2/controllers/controller.php:20 9 K2Controller->display() JROOT/components/com_k2/controllers/itemlist.php:50 8 K2ControllerItemlist->display() JROOT/libraries/src/MVC/Controller/BaseController.php:702 7 Joomla\CMS\MVC\Controller\BaseController->execute() JROOT/components/com_k2/k2.php:57 6 require_once JROOT/components/com_k2/k2.php JROOT/libraries/src/Component/ComponentHelper.php:402 5 Joomla\CMS\Component\ComponentHelper::executeComponent() JROOT/libraries/src/Component/ComponentHelper.php:377 4 Joomla\CMS\Component\ComponentHelper::renderComponent() JROOT/libraries/src/Application/SiteApplication.php:194 3 Joomla\CMS\Application\SiteApplication->dispatch() JROOT/libraries/src/Application/SiteApplication.php:233 2 Joomla\CMS\Application\SiteApplication->doExecute() JROOT/libraries/src/Application/CMSApplication.php:225 1 Joomla\CMS\Application\CMSApplication->execute() JROOT/index.php:49 - Query Time: 1.00 ms After last query: 0.73 ms Query memory: 0.009 MB Memory before query: 20.890 MB Rows returned: 1
SELECT id, gender, description, image, url, `
group`, plugins
FROM w0v41_k2_users
WHERE userID=111id select_type table partitions type possible_keys key key_len ref rows filtered Extra 1 SIMPLE w0v41_k2_users NULL ref userID userID 4 const 1 100.00 NULL No SHOW PROFILE (maybe because there are more than 100 queries)# Caller File and line number 20 JDatabaseDriverMysqli->execute() JROOT/libraries/joomla/database/driver.php:1662 19 JDatabaseDriver->loadObject() JROOT/components/com_k2/models/item.php:1681 18 K2ModelItem->getUserProfile() JROOT/components/com_k2/helpers/utilities.php:45 17 K2HelperUtilities::getAvatar() JROOT/components/com_k2/models/item.php:211 16 K2ModelItem->prepareItem() Same as call in the line below. 15 call_user_func_array() JROOT/libraries/src/Cache/Controller/CallbackController.php:173 14 Joomla\CMS\Cache\Controller\CallbackController->get() JROOT/libraries/src/Cache/Controller/CallbackController.php:45 13 Joomla\CMS\Cache\Controller\CallbackController->call() JROOT/components/com_k2/views/itemlist/view.html.php:695 12 K2ViewItemlist->display() JROOT/libraries/src/Cache/Controller/ViewController.php:102 11 Joomla\CMS\Cache\Controller\ViewController->get() JROOT/libraries/src/MVC/Controller/BaseController.php:655 10 Joomla\CMS\MVC\Controller\BaseController->display() JROOT/components/com_k2/controllers/controller.php:20 9 K2Controller->display() JROOT/components/com_k2/controllers/itemlist.php:50 8 K2ControllerItemlist->display() JROOT/libraries/src/MVC/Controller/BaseController.php:702 7 Joomla\CMS\MVC\Controller\BaseController->execute() JROOT/components/com_k2/k2.php:57 6 require_once JROOT/components/com_k2/k2.php JROOT/libraries/src/Component/ComponentHelper.php:402 5 Joomla\CMS\Component\ComponentHelper::executeComponent() JROOT/libraries/src/Component/ComponentHelper.php:377 4 Joomla\CMS\Component\ComponentHelper::renderComponent() JROOT/libraries/src/Application/SiteApplication.php:194 3 Joomla\CMS\Application\SiteApplication->dispatch() JROOT/libraries/src/Application/SiteApplication.php:233 2 Joomla\CMS\Application\SiteApplication->doExecute() JROOT/libraries/src/Application/CMSApplication.php:225 1 Joomla\CMS\Application\CMSApplication->execute() JROOT/index.php:49 - Query Time: 3.87 ms After last query: 17.74 ms Query memory: 0.010 MB Memory before query: 21.483 MB Rows returned: 0
SELECT DISTINCT a.id, a.title, a.name, a.checked_out, a.checked_out_time, a.note, a.state, a.access, a.created_time, a.created_user_id, a.ordering, a.language, a.fieldparams, a.params, a.type, a.default_value, a.context, a.group_id, a.label, a.description, a.required,l.title AS language_title, l.image AS language_image,uc.name AS editor,ag.title AS access_level,ua.name AS author_name,g.title AS group_title, g.access as group_access, g.state AS group_state, g.note as group_note
FROM w0v41_fields AS a
LEFT JOIN `w0v41_languages` AS l
ON l.lang_code = a.language
LEFT JOIN w0v41_users AS uc
ON uc.id=a.checked_out
LEFT JOIN w0v41_viewlevels AS ag
ON ag.id = a.access
LEFT JOIN w0v41_users AS ua
ON ua.id = a.created_user_id
LEFT JOIN w0v41_fields_groups AS g
ON g.id = a.group_id
LEFT JOIN `w0v41_fields_categories` AS fc
ON fc.field_id = a.id
WHERE a.context = 'com_k2.itemlist'
AND (fc.category_id IS NULL OR fc.category_id IN (3,0))
AND a.access IN (1,1,5)
AND (a.group_id = 0 OR g.access IN (1,1,5))
AND a.state = 1
AND (a.group_id = 0 OR g.state = 1)
AND a.language in ('*','en-GB')
ORDER BY a.ordering ASCid select_type table partitions type possible_keys key key_len ref rows filtered Extra 1 SIMPLE a NULL ref idx_state,idx_access,idx_context,idx_language idx_state 1 const 1 100.00 Using where; Using temporary; Using filesort 1 SIMPLE l NULL eq_ref idx_langcode idx_langcode 28 h88876_SDAT.a.language 1 100.00 Using index condition 1 SIMPLE uc NULL eq_ref PRIMARY PRIMARY 4 h88876_SDAT.a.checked_out 1 100.00 NULL 1 SIMPLE ag NULL eq_ref PRIMARY PRIMARY 4 h88876_SDAT.a.access 1 100.00 Using where 1 SIMPLE ua NULL eq_ref PRIMARY PRIMARY 4 h88876_SDAT.a.created_user_id 1 100.00 Using where 1 SIMPLE g NULL eq_ref PRIMARY PRIMARY 4 h88876_SDAT.a.group_id 1 100.00 Using where 1 SIMPLE fc NULL ref PRIMARY PRIMARY 4 h88876_SDAT.a.id 1 100.00 Using where; Using index; Distinct No SHOW PROFILE (maybe because there are more than 100 queries)# Caller File and line number 22 JDatabaseDriverMysqli->execute() JROOT/libraries/joomla/database/driver.php:1701 21 JDatabaseDriver->loadObjectList() JROOT/libraries/src/MVC/Model/BaseDatabaseModel.php:322 20 Joomla\CMS\MVC\Model\BaseDatabaseModel->_getList() JROOT/administrator/components/com_fields/models/fields.php:333 19 FieldsModelFields->_getList() JROOT/libraries/src/MVC/Model/ListModel.php:194 18 Joomla\CMS\MVC\Model\ListModel->getItems() JROOT/administrator/components/com_fields/helpers/fields.php:136 17 FieldsHelper::getFields() JROOT/plugins/system/fields/fields.php:495 16 PlgSystemFields->onContentPrepare() JROOT/libraries/joomla/event/event.php:70 15 JEvent->update() JROOT/libraries/joomla/event/dispatcher.php:160 14 JEventDispatcher->trigger() JROOT/components/com_k2/models/item.php:667 13 K2ModelItem->execPlugins() JROOT/components/com_k2/views/itemlist/view.html.php:704 12 K2ViewItemlist->display() JROOT/libraries/src/Cache/Controller/ViewController.php:102 11 Joomla\CMS\Cache\Controller\ViewController->get() JROOT/libraries/src/MVC/Controller/BaseController.php:655 10 Joomla\CMS\MVC\Controller\BaseController->display() JROOT/components/com_k2/controllers/controller.php:20 9 K2Controller->display() JROOT/components/com_k2/controllers/itemlist.php:50 8 K2ControllerItemlist->display() JROOT/libraries/src/MVC/Controller/BaseController.php:702 7 Joomla\CMS\MVC\Controller\BaseController->execute() JROOT/components/com_k2/k2.php:57 6 require_once JROOT/components/com_k2/k2.php JROOT/libraries/src/Component/ComponentHelper.php:402 5 Joomla\CMS\Component\ComponentHelper::executeComponent() JROOT/libraries/src/Component/ComponentHelper.php:377 4 Joomla\CMS\Component\ComponentHelper::renderComponent() JROOT/libraries/src/Application/SiteApplication.php:194 3 Joomla\CMS\Application\SiteApplication->dispatch() JROOT/libraries/src/Application/SiteApplication.php:233 2 Joomla\CMS\Application\SiteApplication->doExecute() JROOT/libraries/src/Application/CMSApplication.php:225 1 Joomla\CMS\Application\CMSApplication->execute() JROOT/index.php:49 - Query Time: 0.41 ms After last query: 16.09 ms Query memory: 0.009 MB Memory before query: 22.415 MB Rows returned: 1
SELECT enabled
FROM w0v41_extensions
WHERE element = 'com_sppagebuilder'
AND type = 'component'id select_type table partitions type possible_keys key key_len ref rows filtered Extra 1 SIMPLE w0v41_extensions NULL ref element_clientid,element_folder_clientid,extension element_clientid 402 const 1 10.00 Using where No SHOW PROFILE (maybe because there are more than 100 queries)# Caller File and line number 19 JDatabaseDriverMysqli->execute() JROOT/libraries/joomla/database/driver.php:1740 18 JDatabaseDriver->loadResult() JROOT/plugins/k2/sppagebuilder/sppagebuilder.php:99 17 plgK2Sppagebuilder->isSppagebuilderEnabled() JROOT/plugins/k2/sppagebuilder/sppagebuilder.php:84 16 plgK2Sppagebuilder->onK2PrepareContent() JROOT/libraries/joomla/event/event.php:70 15 JEvent->update() JROOT/libraries/joomla/event/dispatcher.php:160 14 JEventDispatcher->trigger() JROOT/components/com_k2/models/item.php:792 13 K2ModelItem->execPlugins() JROOT/components/com_k2/views/itemlist/view.html.php:704 12 K2ViewItemlist->display() JROOT/libraries/src/Cache/Controller/ViewController.php:102 11 Joomla\CMS\Cache\Controller\ViewController->get() JROOT/libraries/src/MVC/Controller/BaseController.php:655 10 Joomla\CMS\MVC\Controller\BaseController->display() JROOT/components/com_k2/controllers/controller.php:20 9 K2Controller->display() JROOT/components/com_k2/controllers/itemlist.php:50 8 K2ControllerItemlist->display() JROOT/libraries/src/MVC/Controller/BaseController.php:702 7 Joomla\CMS\MVC\Controller\BaseController->execute() JROOT/components/com_k2/k2.php:57 6 require_once JROOT/components/com_k2/k2.php JROOT/libraries/src/Component/ComponentHelper.php:402 5 Joomla\CMS\Component\ComponentHelper::executeComponent() JROOT/libraries/src/Component/ComponentHelper.php:377 4 Joomla\CMS\Component\ComponentHelper::renderComponent() JROOT/libraries/src/Application/SiteApplication.php:194 3 Joomla\CMS\Application\SiteApplication->dispatch() JROOT/libraries/src/Application/SiteApplication.php:233 2 Joomla\CMS\Application\SiteApplication->doExecute() JROOT/libraries/src/Application/CMSApplication.php:225 1 Joomla\CMS\Application\CMSApplication->execute() JROOT/index.php:49 - Query Time: 2.74 ms After last query: 0.29 ms Query memory: 0.009 MB Memory before query: 22.430 MB Rows returned: 0Duplicate queries: #32
SELECT *
FROM `w0v41_sppagebuilder`
WHERE `extension` = 'com_k2'
AND `extension_view` = 'itemlist'
AND `view_id` = '13'
AND `active` = 1id select_type table partitions type possible_keys key key_len ref rows filtered Extra 1 SIMPLE w0v41_sppagebuilder NULL ALL NULL NO INDEX KEY COULD BE USED NULL NULL 131 0.76 Using where No SHOW PROFILE (maybe because there are more than 100 queries)# Caller File and line number 20 JDatabaseDriverMysqli->execute() JROOT/libraries/joomla/database/driver.php:1662 19 JDatabaseDriver->loadObject() JROOT/administrator/components/com_sppagebuilder/helpers/sppagebuilder.php:291 18 SppagebuilderHelper::getPageContent() JROOT/administrator/components/com_sppagebuilder/helpers/sppagebuilder.php:248 17 SppagebuilderHelper::onIntegrationPrepareContent() JROOT/plugins/k2/sppagebuilder/sppagebuilder.php:87 16 plgK2Sppagebuilder->onK2PrepareContent() JROOT/libraries/joomla/event/event.php:70 15 JEvent->update() JROOT/libraries/joomla/event/dispatcher.php:160 14 JEventDispatcher->trigger() JROOT/components/com_k2/models/item.php:792 13 K2ModelItem->execPlugins() JROOT/components/com_k2/views/itemlist/view.html.php:704 12 K2ViewItemlist->display() JROOT/libraries/src/Cache/Controller/ViewController.php:102 11 Joomla\CMS\Cache\Controller\ViewController->get() JROOT/libraries/src/MVC/Controller/BaseController.php:655 10 Joomla\CMS\MVC\Controller\BaseController->display() JROOT/components/com_k2/controllers/controller.php:20 9 K2Controller->display() JROOT/components/com_k2/controllers/itemlist.php:50 8 K2ControllerItemlist->display() JROOT/libraries/src/MVC/Controller/BaseController.php:702 7 Joomla\CMS\MVC\Controller\BaseController->execute() JROOT/components/com_k2/k2.php:57 6 require_once JROOT/components/com_k2/k2.php JROOT/libraries/src/Component/ComponentHelper.php:402 5 Joomla\CMS\Component\ComponentHelper::executeComponent() JROOT/libraries/src/Component/ComponentHelper.php:377 4 Joomla\CMS\Component\ComponentHelper::renderComponent() JROOT/libraries/src/Application/SiteApplication.php:194 3 Joomla\CMS\Application\SiteApplication->dispatch() JROOT/libraries/src/Application/SiteApplication.php:233 2 Joomla\CMS\Application\SiteApplication->doExecute() JROOT/libraries/src/Application/CMSApplication.php:225 1 Joomla\CMS\Application\CMSApplication->execute() JROOT/index.php:49 - Query Time: 0.90 ms After last query: 0.09 ms Query memory: 0.009 MB Memory before query: 22.439 MB Rows returned: 0Duplicate queries: #31
SELECT *
FROM `w0v41_sppagebuilder`
WHERE `extension` = 'com_k2'
AND `extension_view` = 'itemlist'
AND `view_id` = '13'
AND `active` = 1id select_type table partitions type possible_keys key key_len ref rows filtered Extra 1 SIMPLE w0v41_sppagebuilder NULL ALL NULL NO INDEX KEY COULD BE USED NULL NULL 131 0.76 Using where No SHOW PROFILE (maybe because there are more than 100 queries)# Caller File and line number 20 JDatabaseDriverMysqli->execute() JROOT/libraries/joomla/database/driver.php:1662 19 JDatabaseDriver->loadObject() JROOT/administrator/components/com_sppagebuilder/helpers/sppagebuilder.php:291 18 SppagebuilderHelper::getPageContent() JROOT/administrator/components/com_sppagebuilder/helpers/sppagebuilder.php:248 17 SppagebuilderHelper::onIntegrationPrepareContent() JROOT/plugins/k2/sppagebuilder/sppagebuilder.php:89 16 plgK2Sppagebuilder->onK2PrepareContent() JROOT/libraries/joomla/event/event.php:70 15 JEvent->update() JROOT/libraries/joomla/event/dispatcher.php:160 14 JEventDispatcher->trigger() JROOT/components/com_k2/models/item.php:792 13 K2ModelItem->execPlugins() JROOT/components/com_k2/views/itemlist/view.html.php:704 12 K2ViewItemlist->display() JROOT/libraries/src/Cache/Controller/ViewController.php:102 11 Joomla\CMS\Cache\Controller\ViewController->get() JROOT/libraries/src/MVC/Controller/BaseController.php:655 10 Joomla\CMS\MVC\Controller\BaseController->display() JROOT/components/com_k2/controllers/controller.php:20 9 K2Controller->display() JROOT/components/com_k2/controllers/itemlist.php:50 8 K2ControllerItemlist->display() JROOT/libraries/src/MVC/Controller/BaseController.php:702 7 Joomla\CMS\MVC\Controller\BaseController->execute() JROOT/components/com_k2/k2.php:57 6 require_once JROOT/components/com_k2/k2.php JROOT/libraries/src/Component/ComponentHelper.php:402 5 Joomla\CMS\Component\ComponentHelper::executeComponent() JROOT/libraries/src/Component/ComponentHelper.php:377 4 Joomla\CMS\Component\ComponentHelper::renderComponent() JROOT/libraries/src/Application/SiteApplication.php:194 3 Joomla\CMS\Application\SiteApplication->dispatch() JROOT/libraries/src/Application/SiteApplication.php:233 2 Joomla\CMS\Application\SiteApplication->doExecute() JROOT/libraries/src/Application/CMSApplication.php:225 1 Joomla\CMS\Application\CMSApplication->execute() JROOT/index.php:49 - Query Time: 0.40 ms After last query: 2.02 ms Query memory: 0.010 MB Memory before query: 22.524 MB Rows returned: 5
SELECT tag.*
FROM w0v41_k2_tags AS tag JOIN w0v41_k2_tags_xref AS xref
ON tag.id = xref.tagID
WHERE tag.published = 1
AND xref.itemID = 12
ORDER BY xref.id ASCid select_type table partitions type possible_keys key key_len ref rows filtered Extra 1 SIMPLE xref NULL ref tagID,itemID itemID 4 const 5 100.00 NULL 1 SIMPLE tag NULL eq_ref PRIMARY,published PRIMARY 4 h88876_SDAT.xref.tagID 1 100.00 Using where No SHOW PROFILE (maybe because there are more than 100 queries)# Caller File and line number 19 JDatabaseDriverMysqli->execute() JROOT/libraries/joomla/database/driver.php:1701 18 JDatabaseDriver->loadObjectList() JROOT/components/com_k2/models/item.php:1201 17 K2ModelItem->getItemTags() JROOT/components/com_k2/models/item.php:111 16 K2ModelItem->prepareItem() Same as call in the line below. 15 call_user_func_array() JROOT/libraries/src/Cache/Controller/CallbackController.php:173 14 Joomla\CMS\Cache\Controller\CallbackController->get() JROOT/libraries/src/Cache/Controller/CallbackController.php:45 13 Joomla\CMS\Cache\Controller\CallbackController->call() JROOT/components/com_k2/views/itemlist/view.html.php:695 12 K2ViewItemlist->display() JROOT/libraries/src/Cache/Controller/ViewController.php:102 11 Joomla\CMS\Cache\Controller\ViewController->get() JROOT/libraries/src/MVC/Controller/BaseController.php:655 10 Joomla\CMS\MVC\Controller\BaseController->display() JROOT/components/com_k2/controllers/controller.php:20 9 K2Controller->display() JROOT/components/com_k2/controllers/itemlist.php:50 8 K2ControllerItemlist->display() JROOT/libraries/src/MVC/Controller/BaseController.php:702 7 Joomla\CMS\MVC\Controller\BaseController->execute() JROOT/components/com_k2/k2.php:57 6 require_once JROOT/components/com_k2/k2.php JROOT/libraries/src/Component/ComponentHelper.php:402 5 Joomla\CMS\Component\ComponentHelper::executeComponent() JROOT/libraries/src/Component/ComponentHelper.php:377 4 Joomla\CMS\Component\ComponentHelper::renderComponent() JROOT/libraries/src/Application/SiteApplication.php:194 3 Joomla\CMS\Application\SiteApplication->dispatch() JROOT/libraries/src/Application/SiteApplication.php:233 2 Joomla\CMS\Application\SiteApplication->doExecute() JROOT/libraries/src/Application/CMSApplication.php:225 1 Joomla\CMS\Application\CMSApplication->execute() JROOT/index.php:49 - Query Time: 0.43 ms After last query: 10.38 ms Query memory: 0.009 MB Memory before query: 22.516 MB Rows returned: 1
SELECT enabled
FROM w0v41_extensions
WHERE element = 'com_sppagebuilder'
AND type = 'component'id select_type table partitions type possible_keys key key_len ref rows filtered Extra 1 SIMPLE w0v41_extensions NULL ref element_clientid,element_folder_clientid,extension element_clientid 402 const 1 10.00 Using where No SHOW PROFILE (maybe because there are more than 100 queries)# Caller File and line number 19 JDatabaseDriverMysqli->execute() JROOT/libraries/joomla/database/driver.php:1740 18 JDatabaseDriver->loadResult() JROOT/plugins/k2/sppagebuilder/sppagebuilder.php:99 17 plgK2Sppagebuilder->isSppagebuilderEnabled() JROOT/plugins/k2/sppagebuilder/sppagebuilder.php:84 16 plgK2Sppagebuilder->onK2PrepareContent() JROOT/libraries/joomla/event/event.php:70 15 JEvent->update() JROOT/libraries/joomla/event/dispatcher.php:160 14 JEventDispatcher->trigger() JROOT/components/com_k2/models/item.php:792 13 K2ModelItem->execPlugins() JROOT/components/com_k2/views/itemlist/view.html.php:704 12 K2ViewItemlist->display() JROOT/libraries/src/Cache/Controller/ViewController.php:102 11 Joomla\CMS\Cache\Controller\ViewController->get() JROOT/libraries/src/MVC/Controller/BaseController.php:655 10 Joomla\CMS\MVC\Controller\BaseController->display() JROOT/components/com_k2/controllers/controller.php:20 9 K2Controller->display() JROOT/components/com_k2/controllers/itemlist.php:50 8 K2ControllerItemlist->display() JROOT/libraries/src/MVC/Controller/BaseController.php:702 7 Joomla\CMS\MVC\Controller\BaseController->execute() JROOT/components/com_k2/k2.php:57 6 require_once JROOT/components/com_k2/k2.php JROOT/libraries/src/Component/ComponentHelper.php:402 5 Joomla\CMS\Component\ComponentHelper::executeComponent() JROOT/libraries/src/Component/ComponentHelper.php:377 4 Joomla\CMS\Component\ComponentHelper::renderComponent() JROOT/libraries/src/Application/SiteApplication.php:194 3 Joomla\CMS\Application\SiteApplication->dispatch() JROOT/libraries/src/Application/SiteApplication.php:233 2 Joomla\CMS\Application\SiteApplication->doExecute() JROOT/libraries/src/Application/CMSApplication.php:225 1 Joomla\CMS\Application\CMSApplication->execute() JROOT/index.php:49 - Query Time: 1.32 ms After last query: 0.08 ms Query memory: 0.009 MB Memory before query: 22.527 MB Rows returned: 0Duplicate queries: #36
SELECT *
FROM `w0v41_sppagebuilder`
WHERE `extension` = 'com_k2'
AND `extension_view` = 'itemlist'
AND `view_id` = '12'
AND `active` = 1id select_type table partitions type possible_keys key key_len ref rows filtered Extra 1 SIMPLE w0v41_sppagebuilder NULL ALL NULL NO INDEX KEY COULD BE USED NULL NULL 131 0.76 Using where No SHOW PROFILE (maybe because there are more than 100 queries)# Caller File and line number 20 JDatabaseDriverMysqli->execute() JROOT/libraries/joomla/database/driver.php:1662 19 JDatabaseDriver->loadObject() JROOT/administrator/components/com_sppagebuilder/helpers/sppagebuilder.php:291 18 SppagebuilderHelper::getPageContent() JROOT/administrator/components/com_sppagebuilder/helpers/sppagebuilder.php:248 17 SppagebuilderHelper::onIntegrationPrepareContent() JROOT/plugins/k2/sppagebuilder/sppagebuilder.php:87 16 plgK2Sppagebuilder->onK2PrepareContent() JROOT/libraries/joomla/event/event.php:70 15 JEvent->update() JROOT/libraries/joomla/event/dispatcher.php:160 14 JEventDispatcher->trigger() JROOT/components/com_k2/models/item.php:792 13 K2ModelItem->execPlugins() JROOT/components/com_k2/views/itemlist/view.html.php:704 12 K2ViewItemlist->display() JROOT/libraries/src/Cache/Controller/ViewController.php:102 11 Joomla\CMS\Cache\Controller\ViewController->get() JROOT/libraries/src/MVC/Controller/BaseController.php:655 10 Joomla\CMS\MVC\Controller\BaseController->display() JROOT/components/com_k2/controllers/controller.php:20 9 K2Controller->display() JROOT/components/com_k2/controllers/itemlist.php:50 8 K2ControllerItemlist->display() JROOT/libraries/src/MVC/Controller/BaseController.php:702 7 Joomla\CMS\MVC\Controller\BaseController->execute() JROOT/components/com_k2/k2.php:57 6 require_once JROOT/components/com_k2/k2.php JROOT/libraries/src/Component/ComponentHelper.php:402 5 Joomla\CMS\Component\ComponentHelper::executeComponent() JROOT/libraries/src/Component/ComponentHelper.php:377 4 Joomla\CMS\Component\ComponentHelper::renderComponent() JROOT/libraries/src/Application/SiteApplication.php:194 3 Joomla\CMS\Application\SiteApplication->dispatch() JROOT/libraries/src/Application/SiteApplication.php:233 2 Joomla\CMS\Application\SiteApplication->doExecute() JROOT/libraries/src/Application/CMSApplication.php:225 1 Joomla\CMS\Application\CMSApplication->execute() JROOT/index.php:49 - Query Time: 0.83 ms After last query: 0.08 ms Query memory: 0.009 MB Memory before query: 22.537 MB Rows returned: 0Duplicate queries: #35
SELECT *
FROM `w0v41_sppagebuilder`
WHERE `extension` = 'com_k2'
AND `extension_view` = 'itemlist'
AND `view_id` = '12'
AND `active` = 1id select_type table partitions type possible_keys key key_len ref rows filtered Extra 1 SIMPLE w0v41_sppagebuilder NULL ALL NULL NO INDEX KEY COULD BE USED NULL NULL 131 0.76 Using where No SHOW PROFILE (maybe because there are more than 100 queries)# Caller File and line number 20 JDatabaseDriverMysqli->execute() JROOT/libraries/joomla/database/driver.php:1662 19 JDatabaseDriver->loadObject() JROOT/administrator/components/com_sppagebuilder/helpers/sppagebuilder.php:291 18 SppagebuilderHelper::getPageContent() JROOT/administrator/components/com_sppagebuilder/helpers/sppagebuilder.php:248 17 SppagebuilderHelper::onIntegrationPrepareContent() JROOT/plugins/k2/sppagebuilder/sppagebuilder.php:89 16 plgK2Sppagebuilder->onK2PrepareContent() JROOT/libraries/joomla/event/event.php:70 15 JEvent->update() JROOT/libraries/joomla/event/dispatcher.php:160 14 JEventDispatcher->trigger() JROOT/components/com_k2/models/item.php:792 13 K2ModelItem->execPlugins() JROOT/components/com_k2/views/itemlist/view.html.php:704 12 K2ViewItemlist->display() JROOT/libraries/src/Cache/Controller/ViewController.php:102 11 Joomla\CMS\Cache\Controller\ViewController->get() JROOT/libraries/src/MVC/Controller/BaseController.php:655 10 Joomla\CMS\MVC\Controller\BaseController->display() JROOT/components/com_k2/controllers/controller.php:20 9 K2Controller->display() JROOT/components/com_k2/controllers/itemlist.php:50 8 K2ControllerItemlist->display() JROOT/libraries/src/MVC/Controller/BaseController.php:702 7 Joomla\CMS\MVC\Controller\BaseController->execute() JROOT/components/com_k2/k2.php:57 6 require_once JROOT/components/com_k2/k2.php JROOT/libraries/src/Component/ComponentHelper.php:402 5 Joomla\CMS\Component\ComponentHelper::executeComponent() JROOT/libraries/src/Component/ComponentHelper.php:377 4 Joomla\CMS\Component\ComponentHelper::renderComponent() JROOT/libraries/src/Application/SiteApplication.php:194 3 Joomla\CMS\Application\SiteApplication->dispatch() JROOT/libraries/src/Application/SiteApplication.php:233 2 Joomla\CMS\Application\SiteApplication->doExecute() JROOT/libraries/src/Application/CMSApplication.php:225 1 Joomla\CMS\Application\CMSApplication->execute() JROOT/index.php:49 - Query Time: 0.39 ms After last query: 1.85 ms Query memory: 0.009 MB Memory before query: 22.617 MB Rows returned: 2
SELECT tag.*
FROM w0v41_k2_tags AS tag JOIN w0v41_k2_tags_xref AS xref
ON tag.id = xref.tagID
WHERE tag.published = 1
AND xref.itemID = 11
ORDER BY xref.id ASCid select_type table partitions type possible_keys key key_len ref rows filtered Extra 1 SIMPLE xref NULL ref tagID,itemID itemID 4 const 2 100.00 NULL 1 SIMPLE tag NULL eq_ref PRIMARY,published PRIMARY 4 h88876_SDAT.xref.tagID 1 100.00 Using where No SHOW PROFILE (maybe because there are more than 100 queries)# Caller File and line number 19 JDatabaseDriverMysqli->execute() JROOT/libraries/joomla/database/driver.php:1701 18 JDatabaseDriver->loadObjectList() JROOT/components/com_k2/models/item.php:1201 17 K2ModelItem->getItemTags() JROOT/components/com_k2/models/item.php:111 16 K2ModelItem->prepareItem() Same as call in the line below. 15 call_user_func_array() JROOT/libraries/src/Cache/Controller/CallbackController.php:173 14 Joomla\CMS\Cache\Controller\CallbackController->get() JROOT/libraries/src/Cache/Controller/CallbackController.php:45 13 Joomla\CMS\Cache\Controller\CallbackController->call() JROOT/components/com_k2/views/itemlist/view.html.php:695 12 K2ViewItemlist->display() JROOT/libraries/src/Cache/Controller/ViewController.php:102 11 Joomla\CMS\Cache\Controller\ViewController->get() JROOT/libraries/src/MVC/Controller/BaseController.php:655 10 Joomla\CMS\MVC\Controller\BaseController->display() JROOT/components/com_k2/controllers/controller.php:20 9 K2Controller->display() JROOT/components/com_k2/controllers/itemlist.php:50 8 K2ControllerItemlist->display() JROOT/libraries/src/MVC/Controller/BaseController.php:702 7 Joomla\CMS\MVC\Controller\BaseController->execute() JROOT/components/com_k2/k2.php:57 6 require_once JROOT/components/com_k2/k2.php JROOT/libraries/src/Component/ComponentHelper.php:402 5 Joomla\CMS\Component\ComponentHelper::executeComponent() JROOT/libraries/src/Component/ComponentHelper.php:377 4 Joomla\CMS\Component\ComponentHelper::renderComponent() JROOT/libraries/src/Application/SiteApplication.php:194 3 Joomla\CMS\Application\SiteApplication->dispatch() JROOT/libraries/src/Application/SiteApplication.php:233 2 Joomla\CMS\Application\SiteApplication->doExecute() JROOT/libraries/src/Application/CMSApplication.php:225 1 Joomla\CMS\Application\CMSApplication->execute() JROOT/index.php:49 - Query Time: 0.48 ms After last query: 7.60 ms Query memory: 0.009 MB Memory before query: 22.593 MB Rows returned: 1
SELECT enabled
FROM w0v41_extensions
WHERE element = 'com_sppagebuilder'
AND type = 'component'id select_type table partitions type possible_keys key key_len ref rows filtered Extra 1 SIMPLE w0v41_extensions NULL ref element_clientid,element_folder_clientid,extension element_clientid 402 const 1 10.00 Using where No SHOW PROFILE (maybe because there are more than 100 queries)# Caller File and line number 19 JDatabaseDriverMysqli->execute() JROOT/libraries/joomla/database/driver.php:1740 18 JDatabaseDriver->loadResult() JROOT/plugins/k2/sppagebuilder/sppagebuilder.php:99 17 plgK2Sppagebuilder->isSppagebuilderEnabled() JROOT/plugins/k2/sppagebuilder/sppagebuilder.php:84 16 plgK2Sppagebuilder->onK2PrepareContent() JROOT/libraries/joomla/event/event.php:70 15 JEvent->update() JROOT/libraries/joomla/event/dispatcher.php:160 14 JEventDispatcher->trigger() JROOT/components/com_k2/models/item.php:792 13 K2ModelItem->execPlugins() JROOT/components/com_k2/views/itemlist/view.html.php:704 12 K2ViewItemlist->display() JROOT/libraries/src/Cache/Controller/ViewController.php:102 11 Joomla\CMS\Cache\Controller\ViewController->get() JROOT/libraries/src/MVC/Controller/BaseController.php:655 10 Joomla\CMS\MVC\Controller\BaseController->display() JROOT/components/com_k2/controllers/controller.php:20 9 K2Controller->display() JROOT/components/com_k2/controllers/itemlist.php:50 8 K2ControllerItemlist->display() JROOT/libraries/src/MVC/Controller/BaseController.php:702 7 Joomla\CMS\MVC\Controller\BaseController->execute() JROOT/components/com_k2/k2.php:57 6 require_once JROOT/components/com_k2/k2.php JROOT/libraries/src/Component/ComponentHelper.php:402 5 Joomla\CMS\Component\ComponentHelper::executeComponent() JROOT/libraries/src/Component/ComponentHelper.php:377 4 Joomla\CMS\Component\ComponentHelper::renderComponent() JROOT/libraries/src/Application/SiteApplication.php:194 3 Joomla\CMS\Application\SiteApplication->dispatch() JROOT/libraries/src/Application/SiteApplication.php:233 2 Joomla\CMS\Application\SiteApplication->doExecute() JROOT/libraries/src/Application/CMSApplication.php:225 1 Joomla\CMS\Application\CMSApplication->execute() JROOT/index.php:49 - Query Time: 1.25 ms After last query: 0.11 ms Query memory: 0.009 MB Memory before query: 22.605 MB Rows returned: 0Duplicate queries: #40
SELECT *
FROM `w0v41_sppagebuilder`
WHERE `extension` = 'com_k2'
AND `extension_view` = 'itemlist'
AND `view_id` = '11'
AND `active` = 1id select_type table partitions type possible_keys key key_len ref rows filtered Extra 1 SIMPLE w0v41_sppagebuilder NULL ALL NULL NO INDEX KEY COULD BE USED NULL NULL 131 0.76 Using where No SHOW PROFILE (maybe because there are more than 100 queries)# Caller File and line number 20 JDatabaseDriverMysqli->execute() JROOT/libraries/joomla/database/driver.php:1662 19 JDatabaseDriver->loadObject() JROOT/administrator/components/com_sppagebuilder/helpers/sppagebuilder.php:291 18 SppagebuilderHelper::getPageContent() JROOT/administrator/components/com_sppagebuilder/helpers/sppagebuilder.php:248 17 SppagebuilderHelper::onIntegrationPrepareContent() JROOT/plugins/k2/sppagebuilder/sppagebuilder.php:87 16 plgK2Sppagebuilder->onK2PrepareContent() JROOT/libraries/joomla/event/event.php:70 15 JEvent->update() JROOT/libraries/joomla/event/dispatcher.php:160 14 JEventDispatcher->trigger() JROOT/components/com_k2/models/item.php:792 13 K2ModelItem->execPlugins() JROOT/components/com_k2/views/itemlist/view.html.php:704 12 K2ViewItemlist->display() JROOT/libraries/src/Cache/Controller/ViewController.php:102 11 Joomla\CMS\Cache\Controller\ViewController->get() JROOT/libraries/src/MVC/Controller/BaseController.php:655 10 Joomla\CMS\MVC\Controller\BaseController->display() JROOT/components/com_k2/controllers/controller.php:20 9 K2Controller->display() JROOT/components/com_k2/controllers/itemlist.php:50 8 K2ControllerItemlist->display() JROOT/libraries/src/MVC/Controller/BaseController.php:702 7 Joomla\CMS\MVC\Controller\BaseController->execute() JROOT/components/com_k2/k2.php:57 6 require_once JROOT/components/com_k2/k2.php JROOT/libraries/src/Component/ComponentHelper.php:402 5 Joomla\CMS\Component\ComponentHelper::executeComponent() JROOT/libraries/src/Component/ComponentHelper.php:377 4 Joomla\CMS\Component\ComponentHelper::renderComponent() JROOT/libraries/src/Application/SiteApplication.php:194 3 Joomla\CMS\Application\SiteApplication->dispatch() JROOT/libraries/src/Application/SiteApplication.php:233 2 Joomla\CMS\Application\SiteApplication->doExecute() JROOT/libraries/src/Application/CMSApplication.php:225 1 Joomla\CMS\Application\CMSApplication->execute() JROOT/index.php:49 - Query Time: 0.80 ms After last query: 0.09 ms Query memory: 0.009 MB Memory before query: 22.614 MB Rows returned: 0Duplicate queries: #39
SELECT *
FROM `w0v41_sppagebuilder`
WHERE `extension` = 'com_k2'
AND `extension_view` = 'itemlist'
AND `view_id` = '11'
AND `active` = 1id select_type table partitions type possible_keys key key_len ref rows filtered Extra 1 SIMPLE w0v41_sppagebuilder NULL ALL NULL NO INDEX KEY COULD BE USED NULL NULL 131 0.76 Using where No SHOW PROFILE (maybe because there are more than 100 queries)# Caller File and line number 20 JDatabaseDriverMysqli->execute() JROOT/libraries/joomla/database/driver.php:1662 19 JDatabaseDriver->loadObject() JROOT/administrator/components/com_sppagebuilder/helpers/sppagebuilder.php:291 18 SppagebuilderHelper::getPageContent() JROOT/administrator/components/com_sppagebuilder/helpers/sppagebuilder.php:248 17 SppagebuilderHelper::onIntegrationPrepareContent() JROOT/plugins/k2/sppagebuilder/sppagebuilder.php:89 16 plgK2Sppagebuilder->onK2PrepareContent() JROOT/libraries/joomla/event/event.php:70 15 JEvent->update() JROOT/libraries/joomla/event/dispatcher.php:160 14 JEventDispatcher->trigger() JROOT/components/com_k2/models/item.php:792 13 K2ModelItem->execPlugins() JROOT/components/com_k2/views/itemlist/view.html.php:704 12 K2ViewItemlist->display() JROOT/libraries/src/Cache/Controller/ViewController.php:102 11 Joomla\CMS\Cache\Controller\ViewController->get() JROOT/libraries/src/MVC/Controller/BaseController.php:655 10 Joomla\CMS\MVC\Controller\BaseController->display() JROOT/components/com_k2/controllers/controller.php:20 9 K2Controller->display() JROOT/components/com_k2/controllers/itemlist.php:50 8 K2ControllerItemlist->display() JROOT/libraries/src/MVC/Controller/BaseController.php:702 7 Joomla\CMS\MVC\Controller\BaseController->execute() JROOT/components/com_k2/k2.php:57 6 require_once JROOT/components/com_k2/k2.php JROOT/libraries/src/Component/ComponentHelper.php:402 5 Joomla\CMS\Component\ComponentHelper::executeComponent() JROOT/libraries/src/Component/ComponentHelper.php:377 4 Joomla\CMS\Component\ComponentHelper::renderComponent() JROOT/libraries/src/Application/SiteApplication.php:194 3 Joomla\CMS\Application\SiteApplication->dispatch() JROOT/libraries/src/Application/SiteApplication.php:233 2 Joomla\CMS\Application\SiteApplication->doExecute() JROOT/libraries/src/Application/CMSApplication.php:225 1 Joomla\CMS\Application\CMSApplication->execute() JROOT/index.php:49 - Query Time: 0.33 ms After last query: 2.29 ms Query memory: 0.009 MB Memory before query: 22.694 MB Rows returned: 0
SELECT tag.*
FROM w0v41_k2_tags AS tag JOIN w0v41_k2_tags_xref AS xref
ON tag.id = xref.tagID
WHERE tag.published = 1
AND xref.itemID = 9
ORDER BY xref.id ASCid select_type table partitions type possible_keys key key_len ref rows filtered Extra 1 SIMPLE xref NULL ref tagID,itemID itemID 4 const 1 100.00 NULL 1 SIMPLE tag NULL eq_ref PRIMARY,published PRIMARY 4 h88876_SDAT.xref.tagID 1 100.00 Using where No SHOW PROFILE (maybe because there are more than 100 queries)# Caller File and line number 19 JDatabaseDriverMysqli->execute() JROOT/libraries/joomla/database/driver.php:1701 18 JDatabaseDriver->loadObjectList() JROOT/components/com_k2/models/item.php:1201 17 K2ModelItem->getItemTags() JROOT/components/com_k2/models/item.php:111 16 K2ModelItem->prepareItem() Same as call in the line below. 15 call_user_func_array() JROOT/libraries/src/Cache/Controller/CallbackController.php:173 14 Joomla\CMS\Cache\Controller\CallbackController->get() JROOT/libraries/src/Cache/Controller/CallbackController.php:45 13 Joomla\CMS\Cache\Controller\CallbackController->call() JROOT/components/com_k2/views/itemlist/view.html.php:695 12 K2ViewItemlist->display() JROOT/libraries/src/Cache/Controller/ViewController.php:102 11 Joomla\CMS\Cache\Controller\ViewController->get() JROOT/libraries/src/MVC/Controller/BaseController.php:655 10 Joomla\CMS\MVC\Controller\BaseController->display() JROOT/components/com_k2/controllers/controller.php:20 9 K2Controller->display() JROOT/components/com_k2/controllers/itemlist.php:50 8 K2ControllerItemlist->display() JROOT/libraries/src/MVC/Controller/BaseController.php:702 7 Joomla\CMS\MVC\Controller\BaseController->execute() JROOT/components/com_k2/k2.php:57 6 require_once JROOT/components/com_k2/k2.php JROOT/libraries/src/Component/ComponentHelper.php:402 5 Joomla\CMS\Component\ComponentHelper::executeComponent() JROOT/libraries/src/Component/ComponentHelper.php:377 4 Joomla\CMS\Component\ComponentHelper::renderComponent() JROOT/libraries/src/Application/SiteApplication.php:194 3 Joomla\CMS\Application\SiteApplication->dispatch() JROOT/libraries/src/Application/SiteApplication.php:233 2 Joomla\CMS\Application\SiteApplication->doExecute() JROOT/libraries/src/Application/CMSApplication.php:225 1 Joomla\CMS\Application\CMSApplication->execute() JROOT/index.php:49 - Query Time: 0.49 ms After last query: 10.42 ms Query memory: 0.009 MB Memory before query: 22.667 MB Rows returned: 1
SELECT enabled
FROM w0v41_extensions
WHERE element = 'com_sppagebuilder'
AND type = 'component'id select_type table partitions type possible_keys key key_len ref rows filtered Extra 1 SIMPLE w0v41_extensions NULL ref element_clientid,element_folder_clientid,extension element_clientid 402 const 1 10.00 Using where No SHOW PROFILE (maybe because there are more than 100 queries)# Caller File and line number 19 JDatabaseDriverMysqli->execute() JROOT/libraries/joomla/database/driver.php:1740 18 JDatabaseDriver->loadResult() JROOT/plugins/k2/sppagebuilder/sppagebuilder.php:99 17 plgK2Sppagebuilder->isSppagebuilderEnabled() JROOT/plugins/k2/sppagebuilder/sppagebuilder.php:84 16 plgK2Sppagebuilder->onK2PrepareContent() JROOT/libraries/joomla/event/event.php:70 15 JEvent->update() JROOT/libraries/joomla/event/dispatcher.php:160 14 JEventDispatcher->trigger() JROOT/components/com_k2/models/item.php:792 13 K2ModelItem->execPlugins() JROOT/components/com_k2/views/itemlist/view.html.php:704 12 K2ViewItemlist->display() JROOT/libraries/src/Cache/Controller/ViewController.php:102 11 Joomla\CMS\Cache\Controller\ViewController->get() JROOT/libraries/src/MVC/Controller/BaseController.php:655 10 Joomla\CMS\MVC\Controller\BaseController->display() JROOT/components/com_k2/controllers/controller.php:20 9 K2Controller->display() JROOT/components/com_k2/controllers/itemlist.php:50 8 K2ControllerItemlist->display() JROOT/libraries/src/MVC/Controller/BaseController.php:702 7 Joomla\CMS\MVC\Controller\BaseController->execute() JROOT/components/com_k2/k2.php:57 6 require_once JROOT/components/com_k2/k2.php JROOT/libraries/src/Component/ComponentHelper.php:402 5 Joomla\CMS\Component\ComponentHelper::executeComponent() JROOT/libraries/src/Component/ComponentHelper.php:377 4 Joomla\CMS\Component\ComponentHelper::renderComponent() JROOT/libraries/src/Application/SiteApplication.php:194 3 Joomla\CMS\Application\SiteApplication->dispatch() JROOT/libraries/src/Application/SiteApplication.php:233 2 Joomla\CMS\Application\SiteApplication->doExecute() JROOT/libraries/src/Application/CMSApplication.php:225 1 Joomla\CMS\Application\CMSApplication->execute() JROOT/index.php:49 - Query Time: 1.24 ms After last query: 0.10 ms Query memory: 0.009 MB Memory before query: 22.679 MB Rows returned: 0Duplicate queries: #44
SELECT *
FROM `w0v41_sppagebuilder`
WHERE `extension` = 'com_k2'
AND `extension_view` = 'itemlist'
AND `view_id` = '9'
AND `active` = 1id select_type table partitions type possible_keys key key_len ref rows filtered Extra 1 SIMPLE w0v41_sppagebuilder NULL ALL NULL NO INDEX KEY COULD BE USED NULL NULL 131 0.76 Using where No SHOW PROFILE (maybe because there are more than 100 queries)# Caller File and line number 20 JDatabaseDriverMysqli->execute() JROOT/libraries/joomla/database/driver.php:1662 19 JDatabaseDriver->loadObject() JROOT/administrator/components/com_sppagebuilder/helpers/sppagebuilder.php:291 18 SppagebuilderHelper::getPageContent() JROOT/administrator/components/com_sppagebuilder/helpers/sppagebuilder.php:248 17 SppagebuilderHelper::onIntegrationPrepareContent() JROOT/plugins/k2/sppagebuilder/sppagebuilder.php:87 16 plgK2Sppagebuilder->onK2PrepareContent() JROOT/libraries/joomla/event/event.php:70 15 JEvent->update() JROOT/libraries/joomla/event/dispatcher.php:160 14 JEventDispatcher->trigger() JROOT/components/com_k2/models/item.php:792 13 K2ModelItem->execPlugins() JROOT/components/com_k2/views/itemlist/view.html.php:704 12 K2ViewItemlist->display() JROOT/libraries/src/Cache/Controller/ViewController.php:102 11 Joomla\CMS\Cache\Controller\ViewController->get() JROOT/libraries/src/MVC/Controller/BaseController.php:655 10 Joomla\CMS\MVC\Controller\BaseController->display() JROOT/components/com_k2/controllers/controller.php:20 9 K2Controller->display() JROOT/components/com_k2/controllers/itemlist.php:50 8 K2ControllerItemlist->display() JROOT/libraries/src/MVC/Controller/BaseController.php:702 7 Joomla\CMS\MVC\Controller\BaseController->execute() JROOT/components/com_k2/k2.php:57 6 require_once JROOT/components/com_k2/k2.php JROOT/libraries/src/Component/ComponentHelper.php:402 5 Joomla\CMS\Component\ComponentHelper::executeComponent() JROOT/libraries/src/Component/ComponentHelper.php:377 4 Joomla\CMS\Component\ComponentHelper::renderComponent() JROOT/libraries/src/Application/SiteApplication.php:194 3 Joomla\CMS\Application\SiteApplication->dispatch() JROOT/libraries/src/Application/SiteApplication.php:233 2 Joomla\CMS\Application\SiteApplication->doExecute() JROOT/libraries/src/Application/CMSApplication.php:225 1 Joomla\CMS\Application\CMSApplication->execute() JROOT/index.php:49 - Query Time: 0.81 ms After last query: 0.09 ms Query memory: 0.009 MB Memory before query: 22.688 MB Rows returned: 0Duplicate queries: #43
SELECT *
FROM `w0v41_sppagebuilder`
WHERE `extension` = 'com_k2'
AND `extension_view` = 'itemlist'
AND `view_id` = '9'
AND `active` = 1id select_type table partitions type possible_keys key key_len ref rows filtered Extra 1 SIMPLE w0v41_sppagebuilder NULL ALL NULL NO INDEX KEY COULD BE USED NULL NULL 131 0.76 Using where No SHOW PROFILE (maybe because there are more than 100 queries)# Caller File and line number 20 JDatabaseDriverMysqli->execute() JROOT/libraries/joomla/database/driver.php:1662 19 JDatabaseDriver->loadObject() JROOT/administrator/components/com_sppagebuilder/helpers/sppagebuilder.php:291 18 SppagebuilderHelper::getPageContent() JROOT/administrator/components/com_sppagebuilder/helpers/sppagebuilder.php:248 17 SppagebuilderHelper::onIntegrationPrepareContent() JROOT/plugins/k2/sppagebuilder/sppagebuilder.php:89 16 plgK2Sppagebuilder->onK2PrepareContent() JROOT/libraries/joomla/event/event.php:70 15 JEvent->update() JROOT/libraries/joomla/event/dispatcher.php:160 14 JEventDispatcher->trigger() JROOT/components/com_k2/models/item.php:792 13 K2ModelItem->execPlugins() JROOT/components/com_k2/views/itemlist/view.html.php:704 12 K2ViewItemlist->display() JROOT/libraries/src/Cache/Controller/ViewController.php:102 11 Joomla\CMS\Cache\Controller\ViewController->get() JROOT/libraries/src/MVC/Controller/BaseController.php:655 10 Joomla\CMS\MVC\Controller\BaseController->display() JROOT/components/com_k2/controllers/controller.php:20 9 K2Controller->display() JROOT/components/com_k2/controllers/itemlist.php:50 8 K2ControllerItemlist->display() JROOT/libraries/src/MVC/Controller/BaseController.php:702 7 Joomla\CMS\MVC\Controller\BaseController->execute() JROOT/components/com_k2/k2.php:57 6 require_once JROOT/components/com_k2/k2.php JROOT/libraries/src/Component/ComponentHelper.php:402 5 Joomla\CMS\Component\ComponentHelper::executeComponent() JROOT/libraries/src/Component/ComponentHelper.php:377 4 Joomla\CMS\Component\ComponentHelper::renderComponent() JROOT/libraries/src/Application/SiteApplication.php:194 3 Joomla\CMS\Application\SiteApplication->dispatch() JROOT/libraries/src/Application/SiteApplication.php:233 2 Joomla\CMS\Application\SiteApplication->doExecute() JROOT/libraries/src/Application/CMSApplication.php:225 1 Joomla\CMS\Application\CMSApplication->execute() JROOT/index.php:49 - Query Time: 0.40 ms After last query: 2.20 ms Query memory: 0.009 MB Memory before query: 22.767 MB Rows returned: 3
SELECT tag.*
FROM w0v41_k2_tags AS tag JOIN w0v41_k2_tags_xref AS xref
ON tag.id = xref.tagID
WHERE tag.published = 1
AND xref.itemID = 1
ORDER BY xref.id ASCid select_type table partitions type possible_keys key key_len ref rows filtered Extra 1 SIMPLE xref NULL ref tagID,itemID itemID 4 const 3 100.00 NULL 1 SIMPLE tag NULL eq_ref PRIMARY,published PRIMARY 4 h88876_SDAT.xref.tagID 1 100.00 Using where No SHOW PROFILE (maybe because there are more than 100 queries)# Caller File and line number 19 JDatabaseDriverMysqli->execute() JROOT/libraries/joomla/database/driver.php:1701 18 JDatabaseDriver->loadObjectList() JROOT/components/com_k2/models/item.php:1201 17 K2ModelItem->getItemTags() JROOT/components/com_k2/models/item.php:111 16 K2ModelItem->prepareItem() Same as call in the line below. 15 call_user_func_array() JROOT/libraries/src/Cache/Controller/CallbackController.php:173 14 Joomla\CMS\Cache\Controller\CallbackController->get() JROOT/libraries/src/Cache/Controller/CallbackController.php:45 13 Joomla\CMS\Cache\Controller\CallbackController->call() JROOT/components/com_k2/views/itemlist/view.html.php:695 12 K2ViewItemlist->display() JROOT/libraries/src/Cache/Controller/ViewController.php:102 11 Joomla\CMS\Cache\Controller\ViewController->get() JROOT/libraries/src/MVC/Controller/BaseController.php:655 10 Joomla\CMS\MVC\Controller\BaseController->display() JROOT/components/com_k2/controllers/controller.php:20 9 K2Controller->display() JROOT/components/com_k2/controllers/itemlist.php:50 8 K2ControllerItemlist->display() JROOT/libraries/src/MVC/Controller/BaseController.php:702 7 Joomla\CMS\MVC\Controller\BaseController->execute() JROOT/components/com_k2/k2.php:57 6 require_once JROOT/components/com_k2/k2.php JROOT/libraries/src/Component/ComponentHelper.php:402 5 Joomla\CMS\Component\ComponentHelper::executeComponent() JROOT/libraries/src/Component/ComponentHelper.php:377 4 Joomla\CMS\Component\ComponentHelper::renderComponent() JROOT/libraries/src/Application/SiteApplication.php:194 3 Joomla\CMS\Application\SiteApplication->dispatch() JROOT/libraries/src/Application/SiteApplication.php:233 2 Joomla\CMS\Application\SiteApplication->doExecute() JROOT/libraries/src/Application/CMSApplication.php:225 1 Joomla\CMS\Application\CMSApplication->execute() JROOT/index.php:49 - Query Time: 0.26 ms After last query: 0.44 ms Query memory: 0.010 MB Memory before query: 22.787 MB Rows returned: 1
SELECT *
FROM `w0v41_users`
WHERE `id` = 110id select_type table partitions type possible_keys key key_len ref rows filtered Extra 1 SIMPLE w0v41_users NULL const PRIMARY PRIMARY 4 const 1 100.00 NULL No SHOW PROFILE (maybe because there are more than 100 queries)# Caller File and line number 23 JDatabaseDriverMysqli->execute() JROOT/libraries/joomla/database/driver.php:1465 22 JDatabaseDriver->loadAssoc() JROOT/libraries/src/Table/User.php:87 21 Joomla\CMS\Table\User->load() JROOT/libraries/src/User/User.php:880 20 Joomla\CMS\User\User->load() JROOT/libraries/src/User/User.php:248 19 Joomla\CMS\User\User->__construct() JROOT/libraries/src/User/User.php:301 18 Joomla\CMS\User\User::getInstance() JROOT/libraries/src/Factory.php:266 17 Joomla\CMS\Factory::getUser() JROOT/components/com_k2/models/item.php:208 16 K2ModelItem->prepareItem() Same as call in the line below. 15 call_user_func_array() JROOT/libraries/src/Cache/Controller/CallbackController.php:173 14 Joomla\CMS\Cache\Controller\CallbackController->get() JROOT/libraries/src/Cache/Controller/CallbackController.php:45 13 Joomla\CMS\Cache\Controller\CallbackController->call() JROOT/components/com_k2/views/itemlist/view.html.php:695 12 K2ViewItemlist->display() JROOT/libraries/src/Cache/Controller/ViewController.php:102 11 Joomla\CMS\Cache\Controller\ViewController->get() JROOT/libraries/src/MVC/Controller/BaseController.php:655 10 Joomla\CMS\MVC\Controller\BaseController->display() JROOT/components/com_k2/controllers/controller.php:20 9 K2Controller->display() JROOT/components/com_k2/controllers/itemlist.php:50 8 K2ControllerItemlist->display() JROOT/libraries/src/MVC/Controller/BaseController.php:702 7 Joomla\CMS\MVC\Controller\BaseController->execute() JROOT/components/com_k2/k2.php:57 6 require_once JROOT/components/com_k2/k2.php JROOT/libraries/src/Component/ComponentHelper.php:402 5 Joomla\CMS\Component\ComponentHelper::executeComponent() JROOT/libraries/src/Component/ComponentHelper.php:377 4 Joomla\CMS\Component\ComponentHelper::renderComponent() JROOT/libraries/src/Application/SiteApplication.php:194 3 Joomla\CMS\Application\SiteApplication->dispatch() JROOT/libraries/src/Application/SiteApplication.php:233 2 Joomla\CMS\Application\SiteApplication->doExecute() JROOT/libraries/src/Application/CMSApplication.php:225 1 Joomla\CMS\Application\CMSApplication->execute() JROOT/index.php:49 - Query Time: 0.28 ms After last query: 0.11 ms Query memory: 0.010 MB Memory before query: 22.801 MB Rows returned: 1
SELECT `g`.`id`,`g`.`title`
FROM `w0v41_usergroups` AS g
INNER JOIN `w0v41_user_usergroup_map` AS m
ON m.group_id = g.id
WHERE `m`.`user_id` = 110id select_type table partitions type possible_keys key key_len ref rows filtered Extra 1 SIMPLE m NULL ref PRIMARY PRIMARY 4 const 1 100.00 Using index 1 SIMPLE g NULL eq_ref PRIMARY PRIMARY 4 h88876_SDAT.m.group_id 1 100.00 NULL No SHOW PROFILE (maybe because there are more than 100 queries)# Caller File and line number 23 JDatabaseDriverMysqli->execute() JROOT/libraries/joomla/database/driver.php:1506 22 JDatabaseDriver->loadAssocList() JROOT/libraries/src/Table/User.php:112 21 Joomla\CMS\Table\User->load() JROOT/libraries/src/User/User.php:880 20 Joomla\CMS\User\User->load() JROOT/libraries/src/User/User.php:248 19 Joomla\CMS\User\User->__construct() JROOT/libraries/src/User/User.php:301 18 Joomla\CMS\User\User::getInstance() JROOT/libraries/src/Factory.php:266 17 Joomla\CMS\Factory::getUser() JROOT/components/com_k2/models/item.php:208 16 K2ModelItem->prepareItem() Same as call in the line below. 15 call_user_func_array() JROOT/libraries/src/Cache/Controller/CallbackController.php:173 14 Joomla\CMS\Cache\Controller\CallbackController->get() JROOT/libraries/src/Cache/Controller/CallbackController.php:45 13 Joomla\CMS\Cache\Controller\CallbackController->call() JROOT/components/com_k2/views/itemlist/view.html.php:695 12 K2ViewItemlist->display() JROOT/libraries/src/Cache/Controller/ViewController.php:102 11 Joomla\CMS\Cache\Controller\ViewController->get() JROOT/libraries/src/MVC/Controller/BaseController.php:655 10 Joomla\CMS\MVC\Controller\BaseController->display() JROOT/components/com_k2/controllers/controller.php:20 9 K2Controller->display() JROOT/components/com_k2/controllers/itemlist.php:50 8 K2ControllerItemlist->display() JROOT/libraries/src/MVC/Controller/BaseController.php:702 7 Joomla\CMS\MVC\Controller\BaseController->execute() JROOT/components/com_k2/k2.php:57 6 require_once JROOT/components/com_k2/k2.php JROOT/libraries/src/Component/ComponentHelper.php:402 5 Joomla\CMS\Component\ComponentHelper::executeComponent() JROOT/libraries/src/Component/ComponentHelper.php:377 4 Joomla\CMS\Component\ComponentHelper::renderComponent() JROOT/libraries/src/Application/SiteApplication.php:194 3 Joomla\CMS\Application\SiteApplication->dispatch() JROOT/libraries/src/Application/SiteApplication.php:233 2 Joomla\CMS\Application\SiteApplication->doExecute() JROOT/libraries/src/Application/CMSApplication.php:225 1 Joomla\CMS\Application\CMSApplication->execute() JROOT/index.php:49 - Query Time: 0.24 ms After last query: 0.92 ms Query memory: 0.009 MB Memory before query: 22.808 MB Rows returned: 1
SELECT id, gender, description, image, url, `
group`, plugins
FROM w0v41_k2_users
WHERE userID=110id select_type table partitions type possible_keys key key_len ref rows filtered Extra 1 SIMPLE w0v41_k2_users NULL ref userID userID 4 const 1 100.00 NULL No SHOW PROFILE (maybe because there are more than 100 queries)# Caller File and line number 20 JDatabaseDriverMysqli->execute() JROOT/libraries/joomla/database/driver.php:1662 19 JDatabaseDriver->loadObject() JROOT/components/com_k2/models/item.php:1681 18 K2ModelItem->getUserProfile() JROOT/components/com_k2/helpers/utilities.php:45 17 K2HelperUtilities::getAvatar() JROOT/components/com_k2/models/item.php:211 16 K2ModelItem->prepareItem() Same as call in the line below. 15 call_user_func_array() JROOT/libraries/src/Cache/Controller/CallbackController.php:173 14 Joomla\CMS\Cache\Controller\CallbackController->get() JROOT/libraries/src/Cache/Controller/CallbackController.php:45 13 Joomla\CMS\Cache\Controller\CallbackController->call() JROOT/components/com_k2/views/itemlist/view.html.php:695 12 K2ViewItemlist->display() JROOT/libraries/src/Cache/Controller/ViewController.php:102 11 Joomla\CMS\Cache\Controller\ViewController->get() JROOT/libraries/src/MVC/Controller/BaseController.php:655 10 Joomla\CMS\MVC\Controller\BaseController->display() JROOT/components/com_k2/controllers/controller.php:20 9 K2Controller->display() JROOT/components/com_k2/controllers/itemlist.php:50 8 K2ControllerItemlist->display() JROOT/libraries/src/MVC/Controller/BaseController.php:702 7 Joomla\CMS\MVC\Controller\BaseController->execute() JROOT/components/com_k2/k2.php:57 6 require_once JROOT/components/com_k2/k2.php JROOT/libraries/src/Component/ComponentHelper.php:402 5 Joomla\CMS\Component\ComponentHelper::executeComponent() JROOT/libraries/src/Component/ComponentHelper.php:377 4 Joomla\CMS\Component\ComponentHelper::renderComponent() JROOT/libraries/src/Application/SiteApplication.php:194 3 Joomla\CMS\Application\SiteApplication->dispatch() JROOT/libraries/src/Application/SiteApplication.php:233 2 Joomla\CMS\Application\SiteApplication->doExecute() JROOT/libraries/src/Application/CMSApplication.php:225 1 Joomla\CMS\Application\CMSApplication->execute() JROOT/index.php:49 - Query Time: 0.54 ms After last query: 10.66 ms Query memory: 0.009 MB Memory before query: 22.781 MB Rows returned: 1
SELECT enabled
FROM w0v41_extensions
WHERE element = 'com_sppagebuilder'
AND type = 'component'id select_type table partitions type possible_keys key key_len ref rows filtered Extra 1 SIMPLE w0v41_extensions NULL ref element_clientid,element_folder_clientid,extension element_clientid 402 const 1 10.00 Using where No SHOW PROFILE (maybe because there are more than 100 queries)# Caller File and line number 19 JDatabaseDriverMysqli->execute() JROOT/libraries/joomla/database/driver.php:1740 18 JDatabaseDriver->loadResult() JROOT/plugins/k2/sppagebuilder/sppagebuilder.php:99 17 plgK2Sppagebuilder->isSppagebuilderEnabled() JROOT/plugins/k2/sppagebuilder/sppagebuilder.php:84 16 plgK2Sppagebuilder->onK2PrepareContent() JROOT/libraries/joomla/event/event.php:70 15 JEvent->update() JROOT/libraries/joomla/event/dispatcher.php:160 14 JEventDispatcher->trigger() JROOT/components/com_k2/models/item.php:792 13 K2ModelItem->execPlugins() JROOT/components/com_k2/views/itemlist/view.html.php:704 12 K2ViewItemlist->display() JROOT/libraries/src/Cache/Controller/ViewController.php:102 11 Joomla\CMS\Cache\Controller\ViewController->get() JROOT/libraries/src/MVC/Controller/BaseController.php:655 10 Joomla\CMS\MVC\Controller\BaseController->display() JROOT/components/com_k2/controllers/controller.php:20 9 K2Controller->display() JROOT/components/com_k2/controllers/itemlist.php:50 8 K2ControllerItemlist->display() JROOT/libraries/src/MVC/Controller/BaseController.php:702 7 Joomla\CMS\MVC\Controller\BaseController->execute() JROOT/components/com_k2/k2.php:57 6 require_once JROOT/components/com_k2/k2.php JROOT/libraries/src/Component/ComponentHelper.php:402 5 Joomla\CMS\Component\ComponentHelper::executeComponent() JROOT/libraries/src/Component/ComponentHelper.php:377 4 Joomla\CMS\Component\ComponentHelper::renderComponent() JROOT/libraries/src/Application/SiteApplication.php:194 3 Joomla\CMS\Application\SiteApplication->dispatch() JROOT/libraries/src/Application/SiteApplication.php:233 2 Joomla\CMS\Application\SiteApplication->doExecute() JROOT/libraries/src/Application/CMSApplication.php:225 1 Joomla\CMS\Application\CMSApplication->execute() JROOT/index.php:49 - Query Time: 1.36 ms After last query: 0.09 ms Query memory: 0.009 MB Memory before query: 22.792 MB Rows returned: 0Duplicate queries: #51
SELECT *
FROM `w0v41_sppagebuilder`
WHERE `extension` = 'com_k2'
AND `extension_view` = 'itemlist'
AND `view_id` = '1'
AND `active` = 1id select_type table partitions type possible_keys key key_len ref rows filtered Extra 1 SIMPLE w0v41_sppagebuilder NULL ALL NULL NO INDEX KEY COULD BE USED NULL NULL 131 0.76 Using where No SHOW PROFILE (maybe because there are more than 100 queries)# Caller File and line number 20 JDatabaseDriverMysqli->execute() JROOT/libraries/joomla/database/driver.php:1662 19 JDatabaseDriver->loadObject() JROOT/administrator/components/com_sppagebuilder/helpers/sppagebuilder.php:291 18 SppagebuilderHelper::getPageContent() JROOT/administrator/components/com_sppagebuilder/helpers/sppagebuilder.php:248 17 SppagebuilderHelper::onIntegrationPrepareContent() JROOT/plugins/k2/sppagebuilder/sppagebuilder.php:87 16 plgK2Sppagebuilder->onK2PrepareContent() JROOT/libraries/joomla/event/event.php:70 15 JEvent->update() JROOT/libraries/joomla/event/dispatcher.php:160 14 JEventDispatcher->trigger() JROOT/components/com_k2/models/item.php:792 13 K2ModelItem->execPlugins() JROOT/components/com_k2/views/itemlist/view.html.php:704 12 K2ViewItemlist->display() JROOT/libraries/src/Cache/Controller/ViewController.php:102 11 Joomla\CMS\Cache\Controller\ViewController->get() JROOT/libraries/src/MVC/Controller/BaseController.php:655 10 Joomla\CMS\MVC\Controller\BaseController->display() JROOT/components/com_k2/controllers/controller.php:20 9 K2Controller->display() JROOT/components/com_k2/controllers/itemlist.php:50 8 K2ControllerItemlist->display() JROOT/libraries/src/MVC/Controller/BaseController.php:702 7 Joomla\CMS\MVC\Controller\BaseController->execute() JROOT/components/com_k2/k2.php:57 6 require_once JROOT/components/com_k2/k2.php JROOT/libraries/src/Component/ComponentHelper.php:402 5 Joomla\CMS\Component\ComponentHelper::executeComponent() JROOT/libraries/src/Component/ComponentHelper.php:377 4 Joomla\CMS\Component\ComponentHelper::renderComponent() JROOT/libraries/src/Application/SiteApplication.php:194 3 Joomla\CMS\Application\SiteApplication->dispatch() JROOT/libraries/src/Application/SiteApplication.php:233 2 Joomla\CMS\Application\SiteApplication->doExecute() JROOT/libraries/src/Application/CMSApplication.php:225 1 Joomla\CMS\Application\CMSApplication->execute() JROOT/index.php:49 - Query Time: 1.07 ms After last query: 0.09 ms Query memory: 0.009 MB Memory before query: 22.801 MB Rows returned: 0Duplicate queries: #50
SELECT *
FROM `w0v41_sppagebuilder`
WHERE `extension` = 'com_k2'
AND `extension_view` = 'itemlist'
AND `view_id` = '1'
AND `active` = 1id select_type table partitions type possible_keys key key_len ref rows filtered Extra 1 SIMPLE w0v41_sppagebuilder NULL ALL NULL NO INDEX KEY COULD BE USED NULL NULL 131 0.76 Using where No SHOW PROFILE (maybe because there are more than 100 queries)# Caller File and line number 20 JDatabaseDriverMysqli->execute() JROOT/libraries/joomla/database/driver.php:1662 19 JDatabaseDriver->loadObject() JROOT/administrator/components/com_sppagebuilder/helpers/sppagebuilder.php:291 18 SppagebuilderHelper::getPageContent() JROOT/administrator/components/com_sppagebuilder/helpers/sppagebuilder.php:248 17 SppagebuilderHelper::onIntegrationPrepareContent() JROOT/plugins/k2/sppagebuilder/sppagebuilder.php:89 16 plgK2Sppagebuilder->onK2PrepareContent() JROOT/libraries/joomla/event/event.php:70 15 JEvent->update() JROOT/libraries/joomla/event/dispatcher.php:160 14 JEventDispatcher->trigger() JROOT/components/com_k2/models/item.php:792 13 K2ModelItem->execPlugins() JROOT/components/com_k2/views/itemlist/view.html.php:704 12 K2ViewItemlist->display() JROOT/libraries/src/Cache/Controller/ViewController.php:102 11 Joomla\CMS\Cache\Controller\ViewController->get() JROOT/libraries/src/MVC/Controller/BaseController.php:655 10 Joomla\CMS\MVC\Controller\BaseController->display() JROOT/components/com_k2/controllers/controller.php:20 9 K2Controller->display() JROOT/components/com_k2/controllers/itemlist.php:50 8 K2ControllerItemlist->display() JROOT/libraries/src/MVC/Controller/BaseController.php:702 7 Joomla\CMS\MVC\Controller\BaseController->execute() JROOT/components/com_k2/k2.php:57 6 require_once JROOT/components/com_k2/k2.php JROOT/libraries/src/Component/ComponentHelper.php:402 5 Joomla\CMS\Component\ComponentHelper::executeComponent() JROOT/libraries/src/Component/ComponentHelper.php:377 4 Joomla\CMS\Component\ComponentHelper::renderComponent() JROOT/libraries/src/Application/SiteApplication.php:194 3 Joomla\CMS\Application\SiteApplication->dispatch() JROOT/libraries/src/Application/SiteApplication.php:233 2 Joomla\CMS\Application\SiteApplication->doExecute() JROOT/libraries/src/Application/CMSApplication.php:225 1 Joomla\CMS\Application\CMSApplication->execute() JROOT/index.php:49 - Query Time: 0.48 ms After last query: 0.08 ms Query memory: 0.007 MB Memory before query: 22.807 MB Rows returned: 13
SELECT id
FROM w0v41_k2_categories
WHERE published=1
AND trash=0
AND access IN(1,1,5)id select_type table partitions type possible_keys key key_len ref rows filtered Extra 1 SIMPLE w0v41_k2_categories NULL ref category,published,access,trash,idx_category trash 2 const 13 100.00 Using where No SHOW PROFILE (maybe because there are more than 100 queries)# Caller File and line number 15 JDatabaseDriverMysqli->execute() JROOT/libraries/joomla/database/driver.php:1550 14 JDatabaseDriver->loadColumn() JROOT/components/com_k2/helpers/permissions.php:225 13 K2HelperPermissions::canAddItem() JROOT/components/com_k2/views/itemlist/view.html.php:752 12 K2ViewItemlist->display() JROOT/libraries/src/Cache/Controller/ViewController.php:102 11 Joomla\CMS\Cache\Controller\ViewController->get() JROOT/libraries/src/MVC/Controller/BaseController.php:655 10 Joomla\CMS\MVC\Controller\BaseController->display() JROOT/components/com_k2/controllers/controller.php:20 9 K2Controller->display() JROOT/components/com_k2/controllers/itemlist.php:50 8 K2ControllerItemlist->display() JROOT/libraries/src/MVC/Controller/BaseController.php:702 7 Joomla\CMS\MVC\Controller\BaseController->execute() JROOT/components/com_k2/k2.php:57 6 require_once JROOT/components/com_k2/k2.php JROOT/libraries/src/Component/ComponentHelper.php:402 5 Joomla\CMS\Component\ComponentHelper::executeComponent() JROOT/libraries/src/Component/ComponentHelper.php:377 4 Joomla\CMS\Component\ComponentHelper::renderComponent() JROOT/libraries/src/Application/SiteApplication.php:194 3 Joomla\CMS\Application\SiteApplication->dispatch() JROOT/libraries/src/Application/SiteApplication.php:233 2 Joomla\CMS\Application\SiteApplication->doExecute() JROOT/libraries/src/Application/CMSApplication.php:225 1 Joomla\CMS\Application\CMSApplication->execute() JROOT/index.php:49 - Query Time: 0.91 ms After last query: 10.34 ms Query memory: 0.004 MB Memory before query: 22.928 MB Rows returned: 0
SELECT folder.*
FROM `w0v41_eventgallery_folder` AS folder
LEFT JOIN `w0v41_eventgallery_file` AS file
ON folder.folder = file.folder
and file.published=1
and file.ismainimage=0
WHERE file.file IS NULL
AND (folder.foldertypeid=1 OR folder.foldertypeid=2 OR folder.foldertypeid=4)id select_type table partitions type possible_keys key key_len ref rows filtered Extra 1 SIMPLE folder NULL ALL NULL NO INDEX KEY COULD BE USED NULL NULL 4 57.81 Using where 1 SIMPLE file NULL ref file,index_folder file 377 h88876_SDAT.folder.folder 38 10.00 Using where; Not exists No SHOW PROFILE (maybe because there are more than 100 queries)# Caller File and line number 9 JDatabaseDriverMysqli->execute() JROOT/libraries/joomla/database/driver.php:1701 8 JDatabaseDriver->loadObjectList() JROOT/plugins/system/picasaupdater/picasaupdater.php:80 7 plgSystemPicasaupdater->onAfterDispatch() JROOT/libraries/joomla/event/event.php:70 6 JEvent->update() JROOT/libraries/joomla/event/dispatcher.php:160 5 JEventDispatcher->trigger() JROOT/libraries/src/Application/BaseApplication.php:108 4 Joomla\CMS\Application\BaseApplication->triggerEvent() JROOT/libraries/src/Application/SiteApplication.php:199 3 Joomla\CMS\Application\SiteApplication->dispatch() JROOT/libraries/src/Application/SiteApplication.php:233 2 Joomla\CMS\Application\SiteApplication->doExecute() JROOT/libraries/src/Application/CMSApplication.php:225 1 Joomla\CMS\Application\CMSApplication->execute() JROOT/index.php:49 - Query Time: 1.16 ms After last query: 2.20 ms Query memory: 0.005 MB Memory before query: 22.985 MB Rows returned: 3
SELECT language,id
FROM `w0v41_menu`
WHERE home = 1
AND published = 1
AND client_id = 0id select_type table partitions type possible_keys key key_len ref rows filtered Extra 1 SIMPLE w0v41_menu NULL ref idx_client_id_parent_id_alias_language idx_client_id_parent_id_alias_language 1 const 216 1.00 Using where No SHOW PROFILE (maybe because there are more than 100 queries)# Caller File and line number 10 JDatabaseDriverMysqli->execute() JROOT/libraries/joomla/database/driver.php:1701 9 JDatabaseDriver->loadObjectList() JROOT/libraries/src/Language/Multilanguage.php:107 8 Joomla\CMS\Language\Multilanguage::getSiteHomePages() JROOT/plugins/system/languagefilter/languagefilter.php:751 7 PlgSystemLanguageFilter->onAfterDispatch() JROOT/libraries/joomla/event/event.php:70 6 JEvent->update() JROOT/libraries/joomla/event/dispatcher.php:160 5 JEventDispatcher->trigger() JROOT/libraries/src/Application/BaseApplication.php:108 4 Joomla\CMS\Application\BaseApplication->triggerEvent() JROOT/libraries/src/Application/SiteApplication.php:199 3 Joomla\CMS\Application\SiteApplication->dispatch() JROOT/libraries/src/Application/SiteApplication.php:233 2 Joomla\CMS\Application\SiteApplication->doExecute() JROOT/libraries/src/Application/CMSApplication.php:225 1 Joomla\CMS\Application\CMSApplication->execute() JROOT/index.php:49 - Query Time: 4.08 ms After last query: 35.54 ms Query memory: 0.009 MB Memory before query: 24.122 MB Rows returned: 63
SELECT m.id, m.title, m.module, m.position, m.content, m.showtitle, m.params, mm.menuid
FROM w0v41_modules AS m
LEFT JOIN w0v41_modules_menu AS mm
ON mm.moduleid = m.id
LEFT JOIN w0v41_extensions AS e
ON e.element = m.module
AND e.client_id = m.client_id
WHERE m.published = 1
AND e.enabled = 1
AND (m.publish_up = '0000-00-00 00:00:00' OR m.publish_up <= '2025-08-29 16:29:05')
AND (m.publish_down = '0000-00-00 00:00:00' OR m.publish_down >= '2025-08-29 16:29:05')
AND m.access IN (1,1,5)
AND m.client_id = 0
AND (mm.menuid = 197 OR mm.menuid <= 0)
AND m.language IN ('en-GB','*')
ORDER BY m.position, m.orderingid select_type table partitions type possible_keys key key_len ref rows filtered Extra 1 SIMPLE m NULL ALL PRIMARY,published,newsfeeds,idx_language NO INDEX KEY COULD BE USED NULL NULL 189 0.82 Using where; Using filesort 1 SIMPLE e NULL ref element_clientid,element_folder_clientid element_clientid 403 h88876_SDAT.m.module,const 1 10.00 Using index condition; Using where 1 SIMPLE mm NULL ref PRIMARY PRIMARY 4 h88876_SDAT.m.id 2 40.00 Using where; Using index No SHOW PROFILE (maybe because there are more than 100 queries)# Caller File and line number 18 JDatabaseDriverMysqli->execute() JROOT/libraries/joomla/database/driver.php:1701 17 JDatabaseDriver->loadObjectList() Same as call in the line below. 16 call_user_func_array() JROOT/libraries/src/Cache/Controller/CallbackController.php:173 15 Joomla\CMS\Cache\Controller\CallbackController->get() JROOT/libraries/src/Helper/ModuleHelper.php:441 14 Joomla\CMS\Helper\ModuleHelper::getModuleList() JROOT/libraries/src/Helper/ModuleHelper.php:371 13 Joomla\CMS\Helper\ModuleHelper::load() JROOT/libraries/src/Helper/ModuleHelper.php:87 12 Joomla\CMS\Helper\ModuleHelper::getModules() JROOT/libraries/src/Document/HtmlDocument.php:601 11 Joomla\CMS\Document\HtmlDocument->countModules() JROOT/plugins/system/helix3/core/helix3.php:512 10 Helix3::countModules() JROOT/plugins/system/helix3/core/helix3.php:459 9 Helix3::rowColumns() JROOT/plugins/system/helix3/core/helix3.php:268 8 Helix3::generatelayout() JROOT/templates/probusiness/index.php:169 7 require JROOT/templates/probusiness/index.php JROOT/libraries/src/Document/HtmlDocument.php:678 6 Joomla\CMS\Document\HtmlDocument->_loadTemplate() JROOT/libraries/src/Document/HtmlDocument.php:740 5 Joomla\CMS\Document\HtmlDocument->_fetchTemplate() JROOT/libraries/src/Document/HtmlDocument.php:555 4 Joomla\CMS\Document\HtmlDocument->parse() JROOT/libraries/src/Application/CMSApplication.php:1098 3 Joomla\CMS\Application\CMSApplication->render() JROOT/libraries/src/Application/SiteApplication.php:778 2 Joomla\CMS\Application\SiteApplication->render() JROOT/libraries/src/Application/CMSApplication.php:231 1 Joomla\CMS\Application\CMSApplication->execute() JROOT/index.php:49 - Query Time: 1.18 ms After last query: 79.56 ms Query memory: 0.007 MB Memory before query: 25.303 MB Rows returned: 159
SELECT *
FROM w0v41_acymailing_configid select_type table partitions type possible_keys key key_len ref rows filtered Extra 1 SIMPLE w0v41_acymailing_config NULL ALL NULL NO INDEX KEY COULD BE USED NULL NULL 159 100.00 NULL No SHOW PROFILE (maybe because there are more than 100 queries)# Caller File and line number 15 JDatabaseDriverMysqli->execute() JROOT/libraries/joomla/database/driver.php:1701 14 JDatabaseDriver->loadObjectList() JROOT/administrator/components/com_acymailing/classes/cpanel.php:17 13 cpanelClass->load() JROOT/administrator/components/com_acymailing/helpers/helper.php:452 12 acymailing_config() JROOT/administrator/components/com_acymailing/helpers/helper.php:1110 11 include_once JROOT/administrator/components/com_acymailing/helpers/helper.php JROOT/modules/mod_acymailing/mod_acymailing.php:12 10 include JROOT/modules/mod_acymailing/mod_acymailing.php JROOT/libraries/src/Helper/ModuleHelper.php:200 9 Joomla\CMS\Helper\ModuleHelper::renderModule() JROOT/libraries/src/Document/Renderer/Html/ModuleRenderer.php:98 8 Joomla\CMS\Document\Renderer\Html\ModuleRenderer->render() JROOT/libraries/src/Document/Renderer/Html/ModulesRenderer.php:47 7 Joomla\CMS\Document\Renderer\Html\ModulesRenderer->render() JROOT/libraries/src/Document/HtmlDocument.php:511 6 Joomla\CMS\Document\HtmlDocument->getBuffer() JROOT/libraries/src/Document/HtmlDocument.php:803 5 Joomla\CMS\Document\HtmlDocument->_renderTemplate() JROOT/libraries/src/Document/HtmlDocument.php:577 4 Joomla\CMS\Document\HtmlDocument->render() JROOT/libraries/src/Application/CMSApplication.php:1112 3 Joomla\CMS\Application\CMSApplication->render() JROOT/libraries/src/Application/SiteApplication.php:778 2 Joomla\CMS\Application\SiteApplication->render() JROOT/libraries/src/Application/CMSApplication.php:231 1 Joomla\CMS\Application\CMSApplication->execute() JROOT/index.php:49 - Query Time: 0.50 ms After last query: 2.19 ms Query memory: 0.006 MB Memory before query: 25.533 MB Rows returned: 3
SELECT *
FROM w0v41_acymailing_list
WHERE type = 'list'
ORDER BY ordering ASCid select_type table partitions type possible_keys key key_len ref rows filtered Extra 1 SIMPLE w0v41_acymailing_list NULL ref typeorderingindex,typeuseridindex typeorderingindex 1 const 2 100.00 NULL No SHOW PROFILE (maybe because there are more than 100 queries)# Caller File and line number 13 JDatabaseDriverMysqli->execute() JROOT/libraries/joomla/database/driver.php:1701 12 JDatabaseDriver->loadObjectList() JROOT/administrator/components/com_acymailing/classes/list.php:29 11 listClass->getLists() JROOT/modules/mod_acymailing/mod_acymailing.php:121 10 include JROOT/modules/mod_acymailing/mod_acymailing.php JROOT/libraries/src/Helper/ModuleHelper.php:200 9 Joomla\CMS\Helper\ModuleHelper::renderModule() JROOT/libraries/src/Document/Renderer/Html/ModuleRenderer.php:98 8 Joomla\CMS\Document\Renderer\Html\ModuleRenderer->render() JROOT/libraries/src/Document/Renderer/Html/ModulesRenderer.php:47 7 Joomla\CMS\Document\Renderer\Html\ModulesRenderer->render() JROOT/libraries/src/Document/HtmlDocument.php:511 6 Joomla\CMS\Document\HtmlDocument->getBuffer() JROOT/libraries/src/Document/HtmlDocument.php:803 5 Joomla\CMS\Document\HtmlDocument->_renderTemplate() JROOT/libraries/src/Document/HtmlDocument.php:577 4 Joomla\CMS\Document\HtmlDocument->render() JROOT/libraries/src/Application/CMSApplication.php:1112 3 Joomla\CMS\Application\CMSApplication->render() JROOT/libraries/src/Application/SiteApplication.php:778 2 Joomla\CMS\Application\SiteApplication->render() JROOT/libraries/src/Application/CMSApplication.php:231 1 Joomla\CMS\Application\CMSApplication->execute() JROOT/index.php:49 - Query Time: 0.71 ms After last query: 19.11 ms Query memory: 0.006 MB Memory before query: 27.204 MB Rows returned: 3
SELECT *
FROM `w0v41_acymailing_fields` as a
WHERE a.`published` = 1
AND (a.access = 'all' OR a.access LIKE ('%,9,%'))
ORDER BY a.`ordering` ASCid select_type table partitions type possible_keys key key_len ref rows filtered Extra 1 SIMPLE a NULL ref orderingindex orderingindex 1 const 2 55.56 Using where No SHOW PROFILE (maybe because there are more than 100 queries)# Caller File and line number 13 JDatabaseDriverMysqli->execute() JROOT/libraries/joomla/database/driver.php:1701 12 JDatabaseDriver->loadObjectList() JROOT/administrator/components/com_acymailing/classes/fields.php:91 11 fieldsClass->getFields() JROOT/modules/mod_acymailing/mod_acymailing.php:207 10 include JROOT/modules/mod_acymailing/mod_acymailing.php JROOT/libraries/src/Helper/ModuleHelper.php:200 9 Joomla\CMS\Helper\ModuleHelper::renderModule() JROOT/libraries/src/Document/Renderer/Html/ModuleRenderer.php:98 8 Joomla\CMS\Document\Renderer\Html\ModuleRenderer->render() JROOT/libraries/src/Document/Renderer/Html/ModulesRenderer.php:47 7 Joomla\CMS\Document\Renderer\Html\ModulesRenderer->render() JROOT/libraries/src/Document/HtmlDocument.php:511 6 Joomla\CMS\Document\HtmlDocument->getBuffer() JROOT/libraries/src/Document/HtmlDocument.php:803 5 Joomla\CMS\Document\HtmlDocument->_renderTemplate() JROOT/libraries/src/Document/HtmlDocument.php:577 4 Joomla\CMS\Document\HtmlDocument->render() JROOT/libraries/src/Application/CMSApplication.php:1112 3 Joomla\CMS\Application\CMSApplication->render() JROOT/libraries/src/Application/SiteApplication.php:778 2 Joomla\CMS\Application\SiteApplication->render() JROOT/libraries/src/Application/CMSApplication.php:231 1 Joomla\CMS\Application\CMSApplication->execute() JROOT/index.php:49 - Query Time: 0.27 ms After last query: 0.06 ms Query memory: 0.006 MB Memory before query: 27.220 MB Rows returned: 3
SELECT *
FROM `w0v41_acymailing_fields`id select_type table partitions type possible_keys key key_len ref rows filtered Extra 1 SIMPLE w0v41_acymailing_fields NULL ALL NULL NO INDEX KEY COULD BE USED NULL NULL 3 100.00 NULL No SHOW PROFILE (maybe because there are more than 100 queries)# Caller File and line number 13 JDatabaseDriverMysqli->execute() JROOT/libraries/joomla/database/driver.php:1701 12 JDatabaseDriver->loadObjectList() JROOT/administrator/components/com_acymailing/classes/fields.php:104 11 fieldsClass->getFields() JROOT/modules/mod_acymailing/mod_acymailing.php:207 10 include JROOT/modules/mod_acymailing/mod_acymailing.php JROOT/libraries/src/Helper/ModuleHelper.php:200 9 Joomla\CMS\Helper\ModuleHelper::renderModule() JROOT/libraries/src/Document/Renderer/Html/ModuleRenderer.php:98 8 Joomla\CMS\Document\Renderer\Html\ModuleRenderer->render() JROOT/libraries/src/Document/Renderer/Html/ModulesRenderer.php:47 7 Joomla\CMS\Document\Renderer\Html\ModulesRenderer->render() JROOT/libraries/src/Document/HtmlDocument.php:511 6 Joomla\CMS\Document\HtmlDocument->getBuffer() JROOT/libraries/src/Document/HtmlDocument.php:803 5 Joomla\CMS\Document\HtmlDocument->_renderTemplate() JROOT/libraries/src/Document/HtmlDocument.php:577 4 Joomla\CMS\Document\HtmlDocument->render() JROOT/libraries/src/Application/CMSApplication.php:1112 3 Joomla\CMS\Application\CMSApplication->render() JROOT/libraries/src/Application/SiteApplication.php:778 2 Joomla\CMS\Application\SiteApplication->render() JROOT/libraries/src/Application/CMSApplication.php:231 1 Joomla\CMS\Application\CMSApplication->execute() JROOT/index.php:49 - Query Time: 0.67 ms After last query: 8.32 ms Query memory: 0.007 MB Memory before query: 27.426 MB Rows returned: 4
SELECT *
FROM w0v41_k2_categories
WHERE parent=0
AND published=1
AND trash=0
AND access IN(1,1,5)
AND language IN ('en-GB', '*')
ORDER BY id ASCid select_type table partitions type possible_keys key key_len ref rows filtered Extra 1 SIMPLE w0v41_k2_categories NULL ref category,parent,published,access,trash,language,idx_category parent 5 const 8 57.14 Using where No SHOW PROFILE (maybe because there are more than 100 queries)# Caller File and line number 16 JDatabaseDriverMysqli->execute() JROOT/libraries/joomla/database/driver.php:1701 15 JDatabaseDriver->loadObjectList() JROOT/modules/mod_k2_tools/helper.php:453 14 modK2ToolsHelper::treerecurse() JROOT/modules/mod_k2_tools/mod_k2_tools.php:70 13 include JROOT/modules/mod_k2_tools/mod_k2_tools.php JROOT/libraries/src/Helper/ModuleHelper.php:200 12 Joomla\CMS\Helper\ModuleHelper::renderModule() Same as call in the line below. 11 call_user_func_array() JROOT/libraries/src/Cache/Controller/CallbackController.php:173 10 Joomla\CMS\Cache\Controller\CallbackController->get() JROOT/libraries/src/Helper/ModuleHelper.php:617 9 Joomla\CMS\Helper\ModuleHelper::moduleCache() JROOT/libraries/src/Document/Renderer/Html/ModuleRenderer.php:95 8 Joomla\CMS\Document\Renderer\Html\ModuleRenderer->render() JROOT/libraries/src/Document/Renderer/Html/ModulesRenderer.php:47 7 Joomla\CMS\Document\Renderer\Html\ModulesRenderer->render() JROOT/libraries/src/Document/HtmlDocument.php:511 6 Joomla\CMS\Document\HtmlDocument->getBuffer() JROOT/libraries/src/Document/HtmlDocument.php:803 5 Joomla\CMS\Document\HtmlDocument->_renderTemplate() JROOT/libraries/src/Document/HtmlDocument.php:577 4 Joomla\CMS\Document\HtmlDocument->render() JROOT/libraries/src/Application/CMSApplication.php:1112 3 Joomla\CMS\Application\CMSApplication->render() JROOT/libraries/src/Application/SiteApplication.php:778 2 Joomla\CMS\Application\SiteApplication->render() JROOT/libraries/src/Application/CMSApplication.php:231 1 Joomla\CMS\Application\CMSApplication->execute() JROOT/index.php:49 - Query Time: 0.54 ms After last query: 0.11 ms Query memory: 0.008 MB Memory before query: 27.452 MB Rows returned: 1
SELECT COUNT(*)
FROM w0v41_k2_items
WHERE catid=1
AND published=1
AND ( publish_up = '0000-00-00 00:00:00' OR publish_up <= '2025-08-29 16:29:05' )
AND ( publish_down = '0000-00-00 00:00:00' OR publish_down >= '2025-08-29 16:29:05' )
AND trash=0
AND access IN(1,1,5)
AND language IN ('en-GB', '*')id select_type table partitions type possible_keys key key_len ref rows filtered Extra 1 SIMPLE w0v41_k2_items NULL ref catid,language,idx_item catid 4 const 6 1.39 Using where No SHOW PROFILE (maybe because there are more than 100 queries)# Caller File and line number 17 JDatabaseDriverMysqli->execute() JROOT/libraries/joomla/database/driver.php:1740 16 JDatabaseDriver->loadResult() JROOT/modules/mod_k2_tools/helper.php:823 15 modK2ToolsHelper::countCategoryItems() JROOT/modules/mod_k2_tools/helper.php:463 14 modK2ToolsHelper::treerecurse() JROOT/modules/mod_k2_tools/mod_k2_tools.php:70 13 include JROOT/modules/mod_k2_tools/mod_k2_tools.php JROOT/libraries/src/Helper/ModuleHelper.php:200 12 Joomla\CMS\Helper\ModuleHelper::renderModule() Same as call in the line below. 11 call_user_func_array() JROOT/libraries/src/Cache/Controller/CallbackController.php:173 10 Joomla\CMS\Cache\Controller\CallbackController->get() JROOT/libraries/src/Helper/ModuleHelper.php:617 9 Joomla\CMS\Helper\ModuleHelper::moduleCache() JROOT/libraries/src/Document/Renderer/Html/ModuleRenderer.php:95 8 Joomla\CMS\Document\Renderer\Html\ModuleRenderer->render() JROOT/libraries/src/Document/Renderer/Html/ModulesRenderer.php:47 7 Joomla\CMS\Document\Renderer\Html\ModulesRenderer->render() JROOT/libraries/src/Document/HtmlDocument.php:511 6 Joomla\CMS\Document\HtmlDocument->getBuffer() JROOT/libraries/src/Document/HtmlDocument.php:803 5 Joomla\CMS\Document\HtmlDocument->_renderTemplate() JROOT/libraries/src/Document/HtmlDocument.php:577 4 Joomla\CMS\Document\HtmlDocument->render() JROOT/libraries/src/Application/CMSApplication.php:1112 3 Joomla\CMS\Application\CMSApplication->render() JROOT/libraries/src/Application/SiteApplication.php:778 2 Joomla\CMS\Application\SiteApplication->render() JROOT/libraries/src/Application/CMSApplication.php:231 1 Joomla\CMS\Application\CMSApplication->execute() JROOT/index.php:49 - Query Time: 0.42 ms After last query: 0.05 ms Query memory: 0.008 MB Memory before query: 27.460 MB Rows returned: 2
SELECT *
FROM w0v41_k2_categories
WHERE parent=1
AND published=1
AND trash=0
AND access IN(1,1,5)
AND language IN ('en-GB', '*')id select_type table partitions type possible_keys key key_len ref rows filtered Extra 1 SIMPLE w0v41_k2_categories NULL ref category,parent,published,access,trash,language,idx_category parent 5 const 2 57.14 Using where No SHOW PROFILE (maybe because there are more than 100 queries)# Caller File and line number 17 JDatabaseDriverMysqli->execute() JROOT/libraries/joomla/database/driver.php:1701 16 JDatabaseDriver->loadObjectList() JROOT/modules/mod_k2_tools/helper.php:380 15 modK2ToolsHelper::hasChildren() JROOT/modules/mod_k2_tools/helper.php:474 14 modK2ToolsHelper::treerecurse() JROOT/modules/mod_k2_tools/mod_k2_tools.php:70 13 include JROOT/modules/mod_k2_tools/mod_k2_tools.php JROOT/libraries/src/Helper/ModuleHelper.php:200 12 Joomla\CMS\Helper\ModuleHelper::renderModule() Same as call in the line below. 11 call_user_func_array() JROOT/libraries/src/Cache/Controller/CallbackController.php:173 10 Joomla\CMS\Cache\Controller\CallbackController->get() JROOT/libraries/src/Helper/ModuleHelper.php:617 9 Joomla\CMS\Helper\ModuleHelper::moduleCache() JROOT/libraries/src/Document/Renderer/Html/ModuleRenderer.php:95 8 Joomla\CMS\Document\Renderer\Html\ModuleRenderer->render() JROOT/libraries/src/Document/Renderer/Html/ModulesRenderer.php:47 7 Joomla\CMS\Document\Renderer\Html\ModulesRenderer->render() JROOT/libraries/src/Document/HtmlDocument.php:511 6 Joomla\CMS\Document\HtmlDocument->getBuffer() JROOT/libraries/src/Document/HtmlDocument.php:803 5 Joomla\CMS\Document\HtmlDocument->_renderTemplate() JROOT/libraries/src/Document/HtmlDocument.php:577 4 Joomla\CMS\Document\HtmlDocument->render() JROOT/libraries/src/Application/CMSApplication.php:1112 3 Joomla\CMS\Application\CMSApplication->render() JROOT/libraries/src/Application/SiteApplication.php:778 2 Joomla\CMS\Application\SiteApplication->render() JROOT/libraries/src/Application/CMSApplication.php:231 1 Joomla\CMS\Application\CMSApplication->execute() JROOT/index.php:49 - Query Time: 0.48 ms After last query: 0.20 ms Query memory: 0.008 MB Memory before query: 27.469 MB Rows returned: 2
SELECT *
FROM w0v41_k2_categories
WHERE parent=1
AND published=1
AND trash=0
AND access IN(1,1,5)
AND language IN ('en-GB', '*')
ORDER BY id ASCid select_type table partitions type possible_keys key key_len ref rows filtered Extra 1 SIMPLE w0v41_k2_categories NULL ref category,parent,published,access,trash,language,idx_category parent 5 const 2 57.14 Using where No SHOW PROFILE (maybe because there are more than 100 queries)# Caller File and line number 17 JDatabaseDriverMysqli->execute() JROOT/libraries/joomla/database/driver.php:1701 16 JDatabaseDriver->loadObjectList() JROOT/modules/mod_k2_tools/helper.php:453 15 modK2ToolsHelper::treerecurse() JROOT/modules/mod_k2_tools/helper.php:476 14 modK2ToolsHelper::treerecurse() JROOT/modules/mod_k2_tools/mod_k2_tools.php:70 13 include JROOT/modules/mod_k2_tools/mod_k2_tools.php JROOT/libraries/src/Helper/ModuleHelper.php:200 12 Joomla\CMS\Helper\ModuleHelper::renderModule() Same as call in the line below. 11 call_user_func_array() JROOT/libraries/src/Cache/Controller/CallbackController.php:173 10 Joomla\CMS\Cache\Controller\CallbackController->get() JROOT/libraries/src/Helper/ModuleHelper.php:617 9 Joomla\CMS\Helper\ModuleHelper::moduleCache() JROOT/libraries/src/Document/Renderer/Html/ModuleRenderer.php:95 8 Joomla\CMS\Document\Renderer\Html\ModuleRenderer->render() JROOT/libraries/src/Document/Renderer/Html/ModulesRenderer.php:47 7 Joomla\CMS\Document\Renderer\Html\ModulesRenderer->render() JROOT/libraries/src/Document/HtmlDocument.php:511 6 Joomla\CMS\Document\HtmlDocument->getBuffer() JROOT/libraries/src/Document/HtmlDocument.php:803 5 Joomla\CMS\Document\HtmlDocument->_renderTemplate() JROOT/libraries/src/Document/HtmlDocument.php:577 4 Joomla\CMS\Document\HtmlDocument->render() JROOT/libraries/src/Application/CMSApplication.php:1112 3 Joomla\CMS\Application\CMSApplication->render() JROOT/libraries/src/Application/SiteApplication.php:778 2 Joomla\CMS\Application\SiteApplication->render() JROOT/libraries/src/Application/CMSApplication.php:231 1 Joomla\CMS\Application\CMSApplication->execute() JROOT/index.php:49 - Query Time: 0.68 ms After last query: 0.09 ms Query memory: 0.009 MB Memory before query: 27.488 MB Rows returned: 1
SELECT COUNT(*)
FROM w0v41_k2_items
WHERE catid=7
AND published=1
AND ( publish_up = '0000-00-00 00:00:00' OR publish_up <= '2025-08-29 16:29:05' )
AND ( publish_down = '0000-00-00 00:00:00' OR publish_down >= '2025-08-29 16:29:05' )
AND trash=0
AND access IN(1,1,5)
AND language IN ('en-GB', '*')id select_type table partitions type possible_keys key key_len ref rows filtered Extra 1 SIMPLE w0v41_k2_items NULL ref catid,language,idx_item catid 4 const 34 1.39 Using where No SHOW PROFILE (maybe because there are more than 100 queries)# Caller File and line number 18 JDatabaseDriverMysqli->execute() JROOT/libraries/joomla/database/driver.php:1740 17 JDatabaseDriver->loadResult() JROOT/modules/mod_k2_tools/helper.php:823 16 modK2ToolsHelper::countCategoryItems() JROOT/modules/mod_k2_tools/helper.php:463 15 modK2ToolsHelper::treerecurse() JROOT/modules/mod_k2_tools/helper.php:476 14 modK2ToolsHelper::treerecurse() JROOT/modules/mod_k2_tools/mod_k2_tools.php:70 13 include JROOT/modules/mod_k2_tools/mod_k2_tools.php JROOT/libraries/src/Helper/ModuleHelper.php:200 12 Joomla\CMS\Helper\ModuleHelper::renderModule() Same as call in the line below. 11 call_user_func_array() JROOT/libraries/src/Cache/Controller/CallbackController.php:173 10 Joomla\CMS\Cache\Controller\CallbackController->get() JROOT/libraries/src/Helper/ModuleHelper.php:617 9 Joomla\CMS\Helper\ModuleHelper::moduleCache() JROOT/libraries/src/Document/Renderer/Html/ModuleRenderer.php:95 8 Joomla\CMS\Document\Renderer\Html\ModuleRenderer->render() JROOT/libraries/src/Document/Renderer/Html/ModulesRenderer.php:47 7 Joomla\CMS\Document\Renderer\Html\ModulesRenderer->render() JROOT/libraries/src/Document/HtmlDocument.php:511 6 Joomla\CMS\Document\HtmlDocument->getBuffer() JROOT/libraries/src/Document/HtmlDocument.php:803 5 Joomla\CMS\Document\HtmlDocument->_renderTemplate() JROOT/libraries/src/Document/HtmlDocument.php:577 4 Joomla\CMS\Document\HtmlDocument->render() JROOT/libraries/src/Application/CMSApplication.php:1112 3 Joomla\CMS\Application\CMSApplication->render() JROOT/libraries/src/Application/SiteApplication.php:778 2 Joomla\CMS\Application\SiteApplication->render() JROOT/libraries/src/Application/CMSApplication.php:231 1 Joomla\CMS\Application\CMSApplication->execute() JROOT/index.php:49 - Query Time: 0.38 ms After last query: 0.05 ms Query memory: 0.014 MB Memory before query: 27.505 MB Rows returned: 0
SELECT *
FROM w0v41_k2_categories
WHERE parent=7
AND published=1
AND trash=0
AND access IN(1,1,5)
AND language IN ('en-GB', '*')id select_type table partitions type possible_keys key key_len ref rows filtered Extra 1 SIMPLE w0v41_k2_categories NULL ref category,parent,published,access,trash,language,idx_category parent 5 const 1 57.14 Using where No SHOW PROFILE (maybe because there are more than 100 queries)# Caller File and line number 18 JDatabaseDriverMysqli->execute() JROOT/libraries/joomla/database/driver.php:1701 17 JDatabaseDriver->loadObjectList() JROOT/modules/mod_k2_tools/helper.php:380 16 modK2ToolsHelper::hasChildren() JROOT/modules/mod_k2_tools/helper.php:474 15 modK2ToolsHelper::treerecurse() JROOT/modules/mod_k2_tools/helper.php:476 14 modK2ToolsHelper::treerecurse() JROOT/modules/mod_k2_tools/mod_k2_tools.php:70 13 include JROOT/modules/mod_k2_tools/mod_k2_tools.php JROOT/libraries/src/Helper/ModuleHelper.php:200 12 Joomla\CMS\Helper\ModuleHelper::renderModule() Same as call in the line below. 11 call_user_func_array() JROOT/libraries/src/Cache/Controller/CallbackController.php:173 10 Joomla\CMS\Cache\Controller\CallbackController->get() JROOT/libraries/src/Helper/ModuleHelper.php:617 9 Joomla\CMS\Helper\ModuleHelper::moduleCache() JROOT/libraries/src/Document/Renderer/Html/ModuleRenderer.php:95 8 Joomla\CMS\Document\Renderer\Html\ModuleRenderer->render() JROOT/libraries/src/Document/Renderer/Html/ModulesRenderer.php:47 7 Joomla\CMS\Document\Renderer\Html\ModulesRenderer->render() JROOT/libraries/src/Document/HtmlDocument.php:511 6 Joomla\CMS\Document\HtmlDocument->getBuffer() JROOT/libraries/src/Document/HtmlDocument.php:803 5 Joomla\CMS\Document\HtmlDocument->_renderTemplate() JROOT/libraries/src/Document/HtmlDocument.php:577 4 Joomla\CMS\Document\HtmlDocument->render() JROOT/libraries/src/Application/CMSApplication.php:1112 3 Joomla\CMS\Application\CMSApplication->render() JROOT/libraries/src/Application/SiteApplication.php:778 2 Joomla\CMS\Application\SiteApplication->render() JROOT/libraries/src/Application/CMSApplication.php:231 1 Joomla\CMS\Application\CMSApplication->execute() JROOT/index.php:49 - Query Time: 0.43 ms After last query: 0.15 ms Query memory: 0.009 MB Memory before query: 27.521 MB Rows returned: 1
SELECT COUNT(*)
FROM w0v41_k2_items
WHERE catid=9
AND published=1
AND ( publish_up = '0000-00-00 00:00:00' OR publish_up <= '2025-08-29 16:29:05' )
AND ( publish_down = '0000-00-00 00:00:00' OR publish_down >= '2025-08-29 16:29:05' )
AND trash=0
AND access IN(1,1,5)
AND language IN ('en-GB', '*')id select_type table partitions type possible_keys key key_len ref rows filtered Extra 1 SIMPLE w0v41_k2_items NULL ref catid,language,idx_item catid 4 const 5 1.39 Using where No SHOW PROFILE (maybe because there are more than 100 queries)# Caller File and line number 18 JDatabaseDriverMysqli->execute() JROOT/libraries/joomla/database/driver.php:1740 17 JDatabaseDriver->loadResult() JROOT/modules/mod_k2_tools/helper.php:823 16 modK2ToolsHelper::countCategoryItems() JROOT/modules/mod_k2_tools/helper.php:463 15 modK2ToolsHelper::treerecurse() JROOT/modules/mod_k2_tools/helper.php:476 14 modK2ToolsHelper::treerecurse() JROOT/modules/mod_k2_tools/mod_k2_tools.php:70 13 include JROOT/modules/mod_k2_tools/mod_k2_tools.php JROOT/libraries/src/Helper/ModuleHelper.php:200 12 Joomla\CMS\Helper\ModuleHelper::renderModule() Same as call in the line below. 11 call_user_func_array() JROOT/libraries/src/Cache/Controller/CallbackController.php:173 10 Joomla\CMS\Cache\Controller\CallbackController->get() JROOT/libraries/src/Helper/ModuleHelper.php:617 9 Joomla\CMS\Helper\ModuleHelper::moduleCache() JROOT/libraries/src/Document/Renderer/Html/ModuleRenderer.php:95 8 Joomla\CMS\Document\Renderer\Html\ModuleRenderer->render() JROOT/libraries/src/Document/Renderer/Html/ModulesRenderer.php:47 7 Joomla\CMS\Document\Renderer\Html\ModulesRenderer->render() JROOT/libraries/src/Document/HtmlDocument.php:511 6 Joomla\CMS\Document\HtmlDocument->getBuffer() JROOT/libraries/src/Document/HtmlDocument.php:803 5 Joomla\CMS\Document\HtmlDocument->_renderTemplate() JROOT/libraries/src/Document/HtmlDocument.php:577 4 Joomla\CMS\Document\HtmlDocument->render() JROOT/libraries/src/Application/CMSApplication.php:1112 3 Joomla\CMS\Application\CMSApplication->render() JROOT/libraries/src/Application/SiteApplication.php:778 2 Joomla\CMS\Application\SiteApplication->render() JROOT/libraries/src/Application/CMSApplication.php:231 1 Joomla\CMS\Application\CMSApplication->execute() JROOT/index.php:49 - Query Time: 0.39 ms After last query: 0.05 ms Query memory: 0.009 MB Memory before query: 27.529 MB Rows returned: 0
SELECT *
FROM w0v41_k2_categories
WHERE parent=9
AND published=1
AND trash=0
AND access IN(1,1,5)
AND language IN ('en-GB', '*')id select_type table partitions type possible_keys key key_len ref rows filtered Extra 1 SIMPLE w0v41_k2_categories NULL ref category,parent,published,access,trash,language,idx_category parent 5 const 1 57.14 Using where No SHOW PROFILE (maybe because there are more than 100 queries)# Caller File and line number 18 JDatabaseDriverMysqli->execute() JROOT/libraries/joomla/database/driver.php:1701 17 JDatabaseDriver->loadObjectList() JROOT/modules/mod_k2_tools/helper.php:380 16 modK2ToolsHelper::hasChildren() JROOT/modules/mod_k2_tools/helper.php:474 15 modK2ToolsHelper::treerecurse() JROOT/modules/mod_k2_tools/helper.php:476 14 modK2ToolsHelper::treerecurse() JROOT/modules/mod_k2_tools/mod_k2_tools.php:70 13 include JROOT/modules/mod_k2_tools/mod_k2_tools.php JROOT/libraries/src/Helper/ModuleHelper.php:200 12 Joomla\CMS\Helper\ModuleHelper::renderModule() Same as call in the line below. 11 call_user_func_array() JROOT/libraries/src/Cache/Controller/CallbackController.php:173 10 Joomla\CMS\Cache\Controller\CallbackController->get() JROOT/libraries/src/Helper/ModuleHelper.php:617 9 Joomla\CMS\Helper\ModuleHelper::moduleCache() JROOT/libraries/src/Document/Renderer/Html/ModuleRenderer.php:95 8 Joomla\CMS\Document\Renderer\Html\ModuleRenderer->render() JROOT/libraries/src/Document/Renderer/Html/ModulesRenderer.php:47 7 Joomla\CMS\Document\Renderer\Html\ModulesRenderer->render() JROOT/libraries/src/Document/HtmlDocument.php:511 6 Joomla\CMS\Document\HtmlDocument->getBuffer() JROOT/libraries/src/Document/HtmlDocument.php:803 5 Joomla\CMS\Document\HtmlDocument->_renderTemplate() JROOT/libraries/src/Document/HtmlDocument.php:577 4 Joomla\CMS\Document\HtmlDocument->render() JROOT/libraries/src/Application/CMSApplication.php:1112 3 Joomla\CMS\Application\CMSApplication->render() JROOT/libraries/src/Application/SiteApplication.php:778 2 Joomla\CMS\Application\SiteApplication->render() JROOT/libraries/src/Application/CMSApplication.php:231 1 Joomla\CMS\Application\CMSApplication->execute() JROOT/index.php:49 - Query Time: 0.47 ms After last query: 0.14 ms Query memory: 0.008 MB Memory before query: 27.530 MB Rows returned: 1
SELECT COUNT(*)
FROM w0v41_k2_items
WHERE catid=2
AND published=1
AND ( publish_up = '0000-00-00 00:00:00' OR publish_up <= '2025-08-29 16:29:05' )
AND ( publish_down = '0000-00-00 00:00:00' OR publish_down >= '2025-08-29 16:29:05' )
AND trash=0
AND access IN(1,1,5)
AND language IN ('en-GB', '*')id select_type table partitions type possible_keys key key_len ref rows filtered Extra 1 SIMPLE w0v41_k2_items NULL ref catid,language,idx_item catid 4 const 1 5.00 Using where No SHOW PROFILE (maybe because there are more than 100 queries)# Caller File and line number 17 JDatabaseDriverMysqli->execute() JROOT/libraries/joomla/database/driver.php:1740 16 JDatabaseDriver->loadResult() JROOT/modules/mod_k2_tools/helper.php:823 15 modK2ToolsHelper::countCategoryItems() JROOT/modules/mod_k2_tools/helper.php:463 14 modK2ToolsHelper::treerecurse() JROOT/modules/mod_k2_tools/mod_k2_tools.php:70 13 include JROOT/modules/mod_k2_tools/mod_k2_tools.php JROOT/libraries/src/Helper/ModuleHelper.php:200 12 Joomla\CMS\Helper\ModuleHelper::renderModule() Same as call in the line below. 11 call_user_func_array() JROOT/libraries/src/Cache/Controller/CallbackController.php:173 10 Joomla\CMS\Cache\Controller\CallbackController->get() JROOT/libraries/src/Helper/ModuleHelper.php:617 9 Joomla\CMS\Helper\ModuleHelper::moduleCache() JROOT/libraries/src/Document/Renderer/Html/ModuleRenderer.php:95 8 Joomla\CMS\Document\Renderer\Html\ModuleRenderer->render() JROOT/libraries/src/Document/Renderer/Html/ModulesRenderer.php:47 7 Joomla\CMS\Document\Renderer\Html\ModulesRenderer->render() JROOT/libraries/src/Document/HtmlDocument.php:511 6 Joomla\CMS\Document\HtmlDocument->getBuffer() JROOT/libraries/src/Document/HtmlDocument.php:803 5 Joomla\CMS\Document\HtmlDocument->_renderTemplate() JROOT/libraries/src/Document/HtmlDocument.php:577 4 Joomla\CMS\Document\HtmlDocument->render() JROOT/libraries/src/Application/CMSApplication.php:1112 3 Joomla\CMS\Application\CMSApplication->render() JROOT/libraries/src/Application/SiteApplication.php:778 2 Joomla\CMS\Application\SiteApplication->render() JROOT/libraries/src/Application/CMSApplication.php:231 1 Joomla\CMS\Application\CMSApplication->execute() JROOT/index.php:49 - Query Time: 0.41 ms After last query: 0.05 ms Query memory: 0.008 MB Memory before query: 27.537 MB Rows returned: 0
SELECT *
FROM w0v41_k2_categories
WHERE parent=2
AND published=1
AND trash=0
AND access IN(1,1,5)
AND language IN ('en-GB', '*')id select_type table partitions type possible_keys key key_len ref rows filtered Extra 1 SIMPLE w0v41_k2_categories NULL ref category,parent,published,access,trash,language,idx_category parent 5 const 1 57.14 Using where No SHOW PROFILE (maybe because there are more than 100 queries)# Caller File and line number 17 JDatabaseDriverMysqli->execute() JROOT/libraries/joomla/database/driver.php:1701 16 JDatabaseDriver->loadObjectList() JROOT/modules/mod_k2_tools/helper.php:380 15 modK2ToolsHelper::hasChildren() JROOT/modules/mod_k2_tools/helper.php:474 14 modK2ToolsHelper::treerecurse() JROOT/modules/mod_k2_tools/mod_k2_tools.php:70 13 include JROOT/modules/mod_k2_tools/mod_k2_tools.php JROOT/libraries/src/Helper/ModuleHelper.php:200 12 Joomla\CMS\Helper\ModuleHelper::renderModule() Same as call in the line below. 11 call_user_func_array() JROOT/libraries/src/Cache/Controller/CallbackController.php:173 10 Joomla\CMS\Cache\Controller\CallbackController->get() JROOT/libraries/src/Helper/ModuleHelper.php:617 9 Joomla\CMS\Helper\ModuleHelper::moduleCache() JROOT/libraries/src/Document/Renderer/Html/ModuleRenderer.php:95 8 Joomla\CMS\Document\Renderer\Html\ModuleRenderer->render() JROOT/libraries/src/Document/Renderer/Html/ModulesRenderer.php:47 7 Joomla\CMS\Document\Renderer\Html\ModulesRenderer->render() JROOT/libraries/src/Document/HtmlDocument.php:511 6 Joomla\CMS\Document\HtmlDocument->getBuffer() JROOT/libraries/src/Document/HtmlDocument.php:803 5 Joomla\CMS\Document\HtmlDocument->_renderTemplate() JROOT/libraries/src/Document/HtmlDocument.php:577 4 Joomla\CMS\Document\HtmlDocument->render() JROOT/libraries/src/Application/CMSApplication.php:1112 3 Joomla\CMS\Application\CMSApplication->render() JROOT/libraries/src/Application/SiteApplication.php:778 2 Joomla\CMS\Application\SiteApplication->render() JROOT/libraries/src/Application/CMSApplication.php:231 1 Joomla\CMS\Application\CMSApplication->execute() JROOT/index.php:49 - Query Time: 0.28 ms After last query: 0.12 ms Query memory: 0.011 MB Memory before query: 27.548 MB Rows returned: 1
SELECT id, alias, parent
FROM w0v41_k2_categories
WHERE published = 1
AND id = 2id select_type table partitions type possible_keys key key_len ref rows filtered Extra 1 SIMPLE w0v41_k2_categories NULL const PRIMARY,category,published,idx_category PRIMARY 4 const 1 100.00 NULL No SHOW PROFILE (maybe because there are more than 100 queries)# Caller File and line number 26 JDatabaseDriverMysqli->execute() JROOT/libraries/joomla/database/driver.php:1662 25 JDatabaseDriver->loadObject() JROOT/components/com_k2/router.php:493 24 getCategoryProps() JROOT/components/com_k2/router.php:501 23 getCategoryPath() JROOT/components/com_k2/router.php:205 22 k2BuildRoute() JROOT/libraries/src/Component/Router/RouterLegacy.php:69 21 Joomla\CMS\Component\Router\RouterLegacy->build() JROOT/libraries/src/Router/SiteRouter.php:532 20 Joomla\CMS\Router\SiteRouter->buildSefRoute() JROOT/libraries/src/Router/SiteRouter.php:502 19 Joomla\CMS\Router\SiteRouter->_buildSefRoute() JROOT/libraries/src/Router/Router.php:281 18 Joomla\CMS\Router\Router->build() JROOT/libraries/src/Router/SiteRouter.php:155 17 Joomla\CMS\Router\SiteRouter->build() JROOT/libraries/src/Router/Route.php:144 16 Joomla\CMS\Router\Route::link() JROOT/libraries/src/Router/Route.php:93 15 Joomla\CMS\Router\Route::_() JROOT/modules/mod_k2_tools/helper.php:479 14 modK2ToolsHelper::treerecurse() JROOT/modules/mod_k2_tools/mod_k2_tools.php:70 13 include JROOT/modules/mod_k2_tools/mod_k2_tools.php JROOT/libraries/src/Helper/ModuleHelper.php:200 12 Joomla\CMS\Helper\ModuleHelper::renderModule() Same as call in the line below. 11 call_user_func_array() JROOT/libraries/src/Cache/Controller/CallbackController.php:173 10 Joomla\CMS\Cache\Controller\CallbackController->get() JROOT/libraries/src/Helper/ModuleHelper.php:617 9 Joomla\CMS\Helper\ModuleHelper::moduleCache() JROOT/libraries/src/Document/Renderer/Html/ModuleRenderer.php:95 8 Joomla\CMS\Document\Renderer\Html\ModuleRenderer->render() JROOT/libraries/src/Document/Renderer/Html/ModulesRenderer.php:47 7 Joomla\CMS\Document\Renderer\Html\ModulesRenderer->render() JROOT/libraries/src/Document/HtmlDocument.php:511 6 Joomla\CMS\Document\HtmlDocument->getBuffer() JROOT/libraries/src/Document/HtmlDocument.php:803 5 Joomla\CMS\Document\HtmlDocument->_renderTemplate() JROOT/libraries/src/Document/HtmlDocument.php:577 4 Joomla\CMS\Document\HtmlDocument->render() JROOT/libraries/src/Application/CMSApplication.php:1112 3 Joomla\CMS\Application\CMSApplication->render() JROOT/libraries/src/Application/SiteApplication.php:778 2 Joomla\CMS\Application\SiteApplication->render() JROOT/libraries/src/Application/CMSApplication.php:231 1 Joomla\CMS\Application\CMSApplication->execute() JROOT/index.php:49 - Query Time: 0.47 ms After last query: 0.09 ms Query memory: 0.008 MB Memory before query: 27.559 MB Rows returned: 1
SELECT COUNT(*)
FROM w0v41_k2_items
WHERE catid=3
AND published=1
AND ( publish_up = '0000-00-00 00:00:00' OR publish_up <= '2025-08-29 16:29:05' )
AND ( publish_down = '0000-00-00 00:00:00' OR publish_down >= '2025-08-29 16:29:05' )
AND trash=0
AND access IN(1,1,5)
AND language IN ('en-GB', '*')id select_type table partitions type possible_keys key key_len ref rows filtered Extra 1 SIMPLE w0v41_k2_items NULL ref catid,language,idx_item catid 4 const 10 1.39 Using where No SHOW PROFILE (maybe because there are more than 100 queries)# Caller File and line number 17 JDatabaseDriverMysqli->execute() JROOT/libraries/joomla/database/driver.php:1740 16 JDatabaseDriver->loadResult() JROOT/modules/mod_k2_tools/helper.php:823 15 modK2ToolsHelper::countCategoryItems() JROOT/modules/mod_k2_tools/helper.php:463 14 modK2ToolsHelper::treerecurse() JROOT/modules/mod_k2_tools/mod_k2_tools.php:70 13 include JROOT/modules/mod_k2_tools/mod_k2_tools.php JROOT/libraries/src/Helper/ModuleHelper.php:200 12 Joomla\CMS\Helper\ModuleHelper::renderModule() Same as call in the line below. 11 call_user_func_array() JROOT/libraries/src/Cache/Controller/CallbackController.php:173 10 Joomla\CMS\Cache\Controller\CallbackController->get() JROOT/libraries/src/Helper/ModuleHelper.php:617 9 Joomla\CMS\Helper\ModuleHelper::moduleCache() JROOT/libraries/src/Document/Renderer/Html/ModuleRenderer.php:95 8 Joomla\CMS\Document\Renderer\Html\ModuleRenderer->render() JROOT/libraries/src/Document/Renderer/Html/ModulesRenderer.php:47 7 Joomla\CMS\Document\Renderer\Html\ModulesRenderer->render() JROOT/libraries/src/Document/HtmlDocument.php:511 6 Joomla\CMS\Document\HtmlDocument->getBuffer() JROOT/libraries/src/Document/HtmlDocument.php:803 5 Joomla\CMS\Document\HtmlDocument->_renderTemplate() JROOT/libraries/src/Document/HtmlDocument.php:577 4 Joomla\CMS\Document\HtmlDocument->render() JROOT/libraries/src/Application/CMSApplication.php:1112 3 Joomla\CMS\Application\CMSApplication->render() JROOT/libraries/src/Application/SiteApplication.php:778 2 Joomla\CMS\Application\SiteApplication->render() JROOT/libraries/src/Application/CMSApplication.php:231 1 Joomla\CMS\Application\CMSApplication->execute() JROOT/index.php:49 - Query Time: 0.39 ms After last query: 0.05 ms Query memory: 0.008 MB Memory before query: 27.566 MB Rows returned: 0
SELECT *
FROM w0v41_k2_categories
WHERE parent=3
AND published=1
AND trash=0
AND access IN(1,1,5)
AND language IN ('en-GB', '*')id select_type table partitions type possible_keys key key_len ref rows filtered Extra 1 SIMPLE w0v41_k2_categories NULL ref category,parent,published,access,trash,language,idx_category parent 5 const 1 57.14 Using where No SHOW PROFILE (maybe because there are more than 100 queries)# Caller File and line number 17 JDatabaseDriverMysqli->execute() JROOT/libraries/joomla/database/driver.php:1701 16 JDatabaseDriver->loadObjectList() JROOT/modules/mod_k2_tools/helper.php:380 15 modK2ToolsHelper::hasChildren() JROOT/modules/mod_k2_tools/helper.php:474 14 modK2ToolsHelper::treerecurse() JROOT/modules/mod_k2_tools/mod_k2_tools.php:70 13 include JROOT/modules/mod_k2_tools/mod_k2_tools.php JROOT/libraries/src/Helper/ModuleHelper.php:200 12 Joomla\CMS\Helper\ModuleHelper::renderModule() Same as call in the line below. 11 call_user_func_array() JROOT/libraries/src/Cache/Controller/CallbackController.php:173 10 Joomla\CMS\Cache\Controller\CallbackController->get() JROOT/libraries/src/Helper/ModuleHelper.php:617 9 Joomla\CMS\Helper\ModuleHelper::moduleCache() JROOT/libraries/src/Document/Renderer/Html/ModuleRenderer.php:95 8 Joomla\CMS\Document\Renderer\Html\ModuleRenderer->render() JROOT/libraries/src/Document/Renderer/Html/ModulesRenderer.php:47 7 Joomla\CMS\Document\Renderer\Html\ModulesRenderer->render() JROOT/libraries/src/Document/HtmlDocument.php:511 6 Joomla\CMS\Document\HtmlDocument->getBuffer() JROOT/libraries/src/Document/HtmlDocument.php:803 5 Joomla\CMS\Document\HtmlDocument->_renderTemplate() JROOT/libraries/src/Document/HtmlDocument.php:577 4 Joomla\CMS\Document\HtmlDocument->render() JROOT/libraries/src/Application/CMSApplication.php:1112 3 Joomla\CMS\Application\CMSApplication->render() JROOT/libraries/src/Application/SiteApplication.php:778 2 Joomla\CMS\Application\SiteApplication->render() JROOT/libraries/src/Application/CMSApplication.php:231 1 Joomla\CMS\Application\CMSApplication->execute() JROOT/index.php:49 - Query Time: 0.40 ms After last query: 0.09 ms Query memory: 0.008 MB Memory before query: 27.576 MB Rows returned: 1
SELECT COUNT(*)
FROM w0v41_k2_items
WHERE catid=4
AND published=1
AND ( publish_up = '0000-00-00 00:00:00' OR publish_up <= '2025-08-29 16:29:05' )
AND ( publish_down = '0000-00-00 00:00:00' OR publish_down >= '2025-08-29 16:29:05' )
AND trash=0
AND access IN(1,1,5)
AND language IN ('en-GB', '*')id select_type table partitions type possible_keys key key_len ref rows filtered Extra 1 SIMPLE w0v41_k2_items NULL ref catid,language,idx_item catid 4 const 1 5.00 Using where No SHOW PROFILE (maybe because there are more than 100 queries)# Caller File and line number 17 JDatabaseDriverMysqli->execute() JROOT/libraries/joomla/database/driver.php:1740 16 JDatabaseDriver->loadResult() JROOT/modules/mod_k2_tools/helper.php:823 15 modK2ToolsHelper::countCategoryItems() JROOT/modules/mod_k2_tools/helper.php:463 14 modK2ToolsHelper::treerecurse() JROOT/modules/mod_k2_tools/mod_k2_tools.php:70 13 include JROOT/modules/mod_k2_tools/mod_k2_tools.php JROOT/libraries/src/Helper/ModuleHelper.php:200 12 Joomla\CMS\Helper\ModuleHelper::renderModule() Same as call in the line below. 11 call_user_func_array() JROOT/libraries/src/Cache/Controller/CallbackController.php:173 10 Joomla\CMS\Cache\Controller\CallbackController->get() JROOT/libraries/src/Helper/ModuleHelper.php:617 9 Joomla\CMS\Helper\ModuleHelper::moduleCache() JROOT/libraries/src/Document/Renderer/Html/ModuleRenderer.php:95 8 Joomla\CMS\Document\Renderer\Html\ModuleRenderer->render() JROOT/libraries/src/Document/Renderer/Html/ModulesRenderer.php:47 7 Joomla\CMS\Document\Renderer\Html\ModulesRenderer->render() JROOT/libraries/src/Document/HtmlDocument.php:511 6 Joomla\CMS\Document\HtmlDocument->getBuffer() JROOT/libraries/src/Document/HtmlDocument.php:803 5 Joomla\CMS\Document\HtmlDocument->_renderTemplate() JROOT/libraries/src/Document/HtmlDocument.php:577 4 Joomla\CMS\Document\HtmlDocument->render() JROOT/libraries/src/Application/CMSApplication.php:1112 3 Joomla\CMS\Application\CMSApplication->render() JROOT/libraries/src/Application/SiteApplication.php:778 2 Joomla\CMS\Application\SiteApplication->render() JROOT/libraries/src/Application/CMSApplication.php:231 1 Joomla\CMS\Application\CMSApplication->execute() JROOT/index.php:49 - Query Time: 0.38 ms After last query: 0.05 ms Query memory: 0.008 MB Memory before query: 27.583 MB Rows returned: 0
SELECT *
FROM w0v41_k2_categories
WHERE parent=4
AND published=1
AND trash=0
AND access IN(1,1,5)
AND language IN ('en-GB', '*')id select_type table partitions type possible_keys key key_len ref rows filtered Extra 1 SIMPLE w0v41_k2_categories NULL ref category,parent,published,access,trash,language,idx_category parent 5 const 1 57.14 Using where No SHOW PROFILE (maybe because there are more than 100 queries)# Caller File and line number 17 JDatabaseDriverMysqli->execute() JROOT/libraries/joomla/database/driver.php:1701 16 JDatabaseDriver->loadObjectList() JROOT/modules/mod_k2_tools/helper.php:380 15 modK2ToolsHelper::hasChildren() JROOT/modules/mod_k2_tools/helper.php:474 14 modK2ToolsHelper::treerecurse() JROOT/modules/mod_k2_tools/mod_k2_tools.php:70 13 include JROOT/modules/mod_k2_tools/mod_k2_tools.php JROOT/libraries/src/Helper/ModuleHelper.php:200 12 Joomla\CMS\Helper\ModuleHelper::renderModule() Same as call in the line below. 11 call_user_func_array() JROOT/libraries/src/Cache/Controller/CallbackController.php:173 10 Joomla\CMS\Cache\Controller\CallbackController->get() JROOT/libraries/src/Helper/ModuleHelper.php:617 9 Joomla\CMS\Helper\ModuleHelper::moduleCache() JROOT/libraries/src/Document/Renderer/Html/ModuleRenderer.php:95 8 Joomla\CMS\Document\Renderer\Html\ModuleRenderer->render() JROOT/libraries/src/Document/Renderer/Html/ModulesRenderer.php:47 7 Joomla\CMS\Document\Renderer\Html\ModulesRenderer->render() JROOT/libraries/src/Document/HtmlDocument.php:511 6 Joomla\CMS\Document\HtmlDocument->getBuffer() JROOT/libraries/src/Document/HtmlDocument.php:803 5 Joomla\CMS\Document\HtmlDocument->_renderTemplate() JROOT/libraries/src/Document/HtmlDocument.php:577 4 Joomla\CMS\Document\HtmlDocument->render() JROOT/libraries/src/Application/CMSApplication.php:1112 3 Joomla\CMS\Application\CMSApplication->render() JROOT/libraries/src/Application/SiteApplication.php:778 2 Joomla\CMS\Application\SiteApplication->render() JROOT/libraries/src/Application/CMSApplication.php:231 1 Joomla\CMS\Application\CMSApplication->execute() JROOT/index.php:49 - Query Time: 0.47 ms After last query: 0.13 ms Query memory: 0.009 MB Memory before query: 27.593 MB Rows returned: 7
SELECT id, name, parent
FROM w0v41_k2_categories
WHERE published=1
AND trash=0
AND access IN(1,1,5)
AND language IN('en-GB', '*')
ORDER BY parentid select_type table partitions type possible_keys key key_len ref rows filtered Extra 1 SIMPLE w0v41_k2_categories NULL ref category,published,access,trash,language,idx_category trash 2 const 13 57.14 Using where; Using filesort No SHOW PROFILE (maybe because there are more than 100 queries)# Caller File and line number 19 JDatabaseDriverMysqli->execute() JROOT/libraries/joomla/database/driver.php:1701 18 JDatabaseDriver->loadObjectList() JROOT/components/com_k2/models/itemlist.php:932 17 K2ModelItemlist->getCategoriesTree() JROOT/components/com_k2/helpers/route.php:261 16 K2HelperRoute::findMenuItem() JROOT/components/com_k2/helpers/route.php:56 15 K2HelperRoute::getCategoryRoute() JROOT/modules/mod_k2_tools/helper.php:479 14 modK2ToolsHelper::treerecurse() JROOT/modules/mod_k2_tools/mod_k2_tools.php:70 13 include JROOT/modules/mod_k2_tools/mod_k2_tools.php JROOT/libraries/src/Helper/ModuleHelper.php:200 12 Joomla\CMS\Helper\ModuleHelper::renderModule() Same as call in the line below. 11 call_user_func_array() JROOT/libraries/src/Cache/Controller/CallbackController.php:173 10 Joomla\CMS\Cache\Controller\CallbackController->get() JROOT/libraries/src/Helper/ModuleHelper.php:617 9 Joomla\CMS\Helper\ModuleHelper::moduleCache() JROOT/libraries/src/Document/Renderer/Html/ModuleRenderer.php:95 8 Joomla\CMS\Document\Renderer\Html\ModuleRenderer->render() JROOT/libraries/src/Document/Renderer/Html/ModulesRenderer.php:47 7 Joomla\CMS\Document\Renderer\Html\ModulesRenderer->render() JROOT/libraries/src/Document/HtmlDocument.php:511 6 Joomla\CMS\Document\HtmlDocument->getBuffer() JROOT/libraries/src/Document/HtmlDocument.php:803 5 Joomla\CMS\Document\HtmlDocument->_renderTemplate() JROOT/libraries/src/Document/HtmlDocument.php:577 4 Joomla\CMS\Document\HtmlDocument->render() JROOT/libraries/src/Application/CMSApplication.php:1112 3 Joomla\CMS\Application\CMSApplication->render() JROOT/libraries/src/Application/SiteApplication.php:778 2 Joomla\CMS\Application\SiteApplication->render() JROOT/libraries/src/Application/CMSApplication.php:231 1 Joomla\CMS\Application\CMSApplication->execute() JROOT/index.php:49 - Query Time: 0.27 ms After last query: 0.11 ms Query memory: 0.011 MB Memory before query: 27.607 MB Rows returned: 1
SELECT id, alias, parent
FROM w0v41_k2_categories
WHERE published = 1
AND id = 4id select_type table partitions type possible_keys key key_len ref rows filtered Extra 1 SIMPLE w0v41_k2_categories NULL const PRIMARY,category,published,idx_category PRIMARY 4 const 1 100.00 NULL No SHOW PROFILE (maybe because there are more than 100 queries)# Caller File and line number 26 JDatabaseDriverMysqli->execute() JROOT/libraries/joomla/database/driver.php:1662 25 JDatabaseDriver->loadObject() JROOT/components/com_k2/router.php:493 24 getCategoryProps() JROOT/components/com_k2/router.php:501 23 getCategoryPath() JROOT/components/com_k2/router.php:205 22 k2BuildRoute() JROOT/libraries/src/Component/Router/RouterLegacy.php:69 21 Joomla\CMS\Component\Router\RouterLegacy->build() JROOT/libraries/src/Router/SiteRouter.php:532 20 Joomla\CMS\Router\SiteRouter->buildSefRoute() JROOT/libraries/src/Router/SiteRouter.php:502 19 Joomla\CMS\Router\SiteRouter->_buildSefRoute() JROOT/libraries/src/Router/Router.php:281 18 Joomla\CMS\Router\Router->build() JROOT/libraries/src/Router/SiteRouter.php:155 17 Joomla\CMS\Router\SiteRouter->build() JROOT/libraries/src/Router/Route.php:144 16 Joomla\CMS\Router\Route::link() JROOT/libraries/src/Router/Route.php:93 15 Joomla\CMS\Router\Route::_() JROOT/modules/mod_k2_tools/helper.php:479 14 modK2ToolsHelper::treerecurse() JROOT/modules/mod_k2_tools/mod_k2_tools.php:70 13 include JROOT/modules/mod_k2_tools/mod_k2_tools.php JROOT/libraries/src/Helper/ModuleHelper.php:200 12 Joomla\CMS\Helper\ModuleHelper::renderModule() Same as call in the line below. 11 call_user_func_array() JROOT/libraries/src/Cache/Controller/CallbackController.php:173 10 Joomla\CMS\Cache\Controller\CallbackController->get() JROOT/libraries/src/Helper/ModuleHelper.php:617 9 Joomla\CMS\Helper\ModuleHelper::moduleCache() JROOT/libraries/src/Document/Renderer/Html/ModuleRenderer.php:95 8 Joomla\CMS\Document\Renderer\Html\ModuleRenderer->render() JROOT/libraries/src/Document/Renderer/Html/ModulesRenderer.php:47 7 Joomla\CMS\Document\Renderer\Html\ModulesRenderer->render() JROOT/libraries/src/Document/HtmlDocument.php:511 6 Joomla\CMS\Document\HtmlDocument->getBuffer() JROOT/libraries/src/Document/HtmlDocument.php:803 5 Joomla\CMS\Document\HtmlDocument->_renderTemplate() JROOT/libraries/src/Document/HtmlDocument.php:577 4 Joomla\CMS\Document\HtmlDocument->render() JROOT/libraries/src/Application/CMSApplication.php:1112 3 Joomla\CMS\Application\CMSApplication->render() JROOT/libraries/src/Application/SiteApplication.php:778 2 Joomla\CMS\Application\SiteApplication->render() JROOT/libraries/src/Application/CMSApplication.php:231 1 Joomla\CMS\Application\CMSApplication->execute() JROOT/index.php:49 - Query Time: 0.82 ms After last query: 5.09 ms Query memory: 0.007 MB Memory before query: 27.610 MB Rows returned: 12
SELECT DISTINCT MONTH(created) as m, YEAR(created) as y
FROM w0v41_k2_items
WHERE published=1
AND ( publish_up = '0000-00-00 00:00:00' OR publish_up <= '2025-08-29 16:29:05' )
AND ( publish_down = '0000-00-00 00:00:00' OR publish_down >= '2025-08-29 16:29:05' )
AND trash=0
AND access IN(1,1,5)
AND language IN ('en-GB', '*')
ORDER BY created DESC
LIMIT 0, 12id select_type table partitions type possible_keys key key_len ref rows filtered Extra 1 SIMPLE w0v41_k2_items NULL index created,language,idx_item created 5 NULL 12 1.39 Using where; Backward index scan; Using temporary No SHOW PROFILE (maybe because there are more than 100 queries)# Caller File and line number 16 JDatabaseDriverMysqli->execute() JROOT/libraries/joomla/database/driver.php:1701 15 JDatabaseDriver->loadObjectList() JROOT/modules/mod_k2_tools/helper.php:175 14 modK2ToolsHelper::getArchive() JROOT/modules/mod_k2_tools/mod_k2_tools.php:39 13 include JROOT/modules/mod_k2_tools/mod_k2_tools.php JROOT/libraries/src/Helper/ModuleHelper.php:200 12 Joomla\CMS\Helper\ModuleHelper::renderModule() Same as call in the line below. 11 call_user_func_array() JROOT/libraries/src/Cache/Controller/CallbackController.php:173 10 Joomla\CMS\Cache\Controller\CallbackController->get() JROOT/libraries/src/Helper/ModuleHelper.php:617 9 Joomla\CMS\Helper\ModuleHelper::moduleCache() JROOT/libraries/src/Document/Renderer/Html/ModuleRenderer.php:95 8 Joomla\CMS\Document\Renderer\Html\ModuleRenderer->render() JROOT/libraries/src/Document/Renderer/Html/ModulesRenderer.php:47 7 Joomla\CMS\Document\Renderer\Html\ModulesRenderer->render() JROOT/libraries/src/Document/HtmlDocument.php:511 6 Joomla\CMS\Document\HtmlDocument->getBuffer() JROOT/libraries/src/Document/HtmlDocument.php:803 5 Joomla\CMS\Document\HtmlDocument->_renderTemplate() JROOT/libraries/src/Document/HtmlDocument.php:577 4 Joomla\CMS\Document\HtmlDocument->render() JROOT/libraries/src/Application/CMSApplication.php:1112 3 Joomla\CMS\Application\CMSApplication->render() JROOT/libraries/src/Application/SiteApplication.php:778 2 Joomla\CMS\Application\SiteApplication->render() JROOT/libraries/src/Application/CMSApplication.php:231 1 Joomla\CMS\Application\CMSApplication->execute() JROOT/index.php:49 - Query Time: 0.72 ms After last query: 0.10 ms Query memory: 0.008 MB Memory before query: 27.626 MB Rows returned: 1
SELECT COUNT(*)
FROM w0v41_k2_items
WHERE MONTH(created)=1
AND YEAR(created)=2021
AND published=1
AND ( publish_up = '0000-00-00 00:00:00' OR publish_up <= '2025-08-29 16:29:05' )
AND ( publish_down = '0000-00-00 00:00:00' OR publish_down >= '2025-08-29 16:29:05' )
AND trash=0
AND access IN(1,1,5)
AND language IN ('en-GB', '*')id select_type table partitions type possible_keys key key_len ref rows filtered Extra 1 SIMPLE w0v41_k2_items NULL range language,idx_item language 21 NULL 71 1.39 Using index condition; Using where No SHOW PROFILE (maybe because there are more than 100 queries)# Caller File and line number 17 JDatabaseDriverMysqli->execute() JROOT/libraries/joomla/database/driver.php:1740 16 JDatabaseDriver->loadResult() JROOT/modules/mod_k2_tools/helper.php:795 15 modK2ToolsHelper::countArchiveItems() JROOT/modules/mod_k2_tools/helper.php:193 14 modK2ToolsHelper::getArchive() JROOT/modules/mod_k2_tools/mod_k2_tools.php:39 13 include JROOT/modules/mod_k2_tools/mod_k2_tools.php JROOT/libraries/src/Helper/ModuleHelper.php:200 12 Joomla\CMS\Helper\ModuleHelper::renderModule() Same as call in the line below. 11 call_user_func_array() JROOT/libraries/src/Cache/Controller/CallbackController.php:173 10 Joomla\CMS\Cache\Controller\CallbackController->get() JROOT/libraries/src/Helper/ModuleHelper.php:617 9 Joomla\CMS\Helper\ModuleHelper::moduleCache() JROOT/libraries/src/Document/Renderer/Html/ModuleRenderer.php:95 8 Joomla\CMS\Document\Renderer\Html\ModuleRenderer->render() JROOT/libraries/src/Document/Renderer/Html/ModulesRenderer.php:47 7 Joomla\CMS\Document\Renderer\Html\ModulesRenderer->render() JROOT/libraries/src/Document/HtmlDocument.php:511 6 Joomla\CMS\Document\HtmlDocument->getBuffer() JROOT/libraries/src/Document/HtmlDocument.php:803 5 Joomla\CMS\Document\HtmlDocument->_renderTemplate() JROOT/libraries/src/Document/HtmlDocument.php:577 4 Joomla\CMS\Document\HtmlDocument->render() JROOT/libraries/src/Application/CMSApplication.php:1112 3 Joomla\CMS\Application\CMSApplication->render() JROOT/libraries/src/Application/SiteApplication.php:778 2 Joomla\CMS\Application\SiteApplication->render() JROOT/libraries/src/Application/CMSApplication.php:231 1 Joomla\CMS\Application\CMSApplication->execute() JROOT/index.php:49 - Query Time: 0.63 ms After last query: 0.15 ms Query memory: 0.008 MB Memory before query: 27.636 MB Rows returned: 1
SELECT COUNT(*)
FROM w0v41_k2_items
WHERE MONTH(created)=12
AND YEAR(created)=2020
AND published=1
AND ( publish_up = '0000-00-00 00:00:00' OR publish_up <= '2025-08-29 16:29:05' )
AND ( publish_down = '0000-00-00 00:00:00' OR publish_down >= '2025-08-29 16:29:05' )
AND trash=0
AND access IN(1,1,5)
AND language IN ('en-GB', '*')id select_type table partitions type possible_keys key key_len ref rows filtered Extra 1 SIMPLE w0v41_k2_items NULL range language,idx_item language 21 NULL 71 1.39 Using index condition; Using where No SHOW PROFILE (maybe because there are more than 100 queries)# Caller File and line number 17 JDatabaseDriverMysqli->execute() JROOT/libraries/joomla/database/driver.php:1740 16 JDatabaseDriver->loadResult() JROOT/modules/mod_k2_tools/helper.php:795 15 modK2ToolsHelper::countArchiveItems() JROOT/modules/mod_k2_tools/helper.php:193 14 modK2ToolsHelper::getArchive() JROOT/modules/mod_k2_tools/mod_k2_tools.php:39 13 include JROOT/modules/mod_k2_tools/mod_k2_tools.php JROOT/libraries/src/Helper/ModuleHelper.php:200 12 Joomla\CMS\Helper\ModuleHelper::renderModule() Same as call in the line below. 11 call_user_func_array() JROOT/libraries/src/Cache/Controller/CallbackController.php:173 10 Joomla\CMS\Cache\Controller\CallbackController->get() JROOT/libraries/src/Helper/ModuleHelper.php:617 9 Joomla\CMS\Helper\ModuleHelper::moduleCache() JROOT/libraries/src/Document/Renderer/Html/ModuleRenderer.php:95 8 Joomla\CMS\Document\Renderer\Html\ModuleRenderer->render() JROOT/libraries/src/Document/Renderer/Html/ModulesRenderer.php:47 7 Joomla\CMS\Document\Renderer\Html\ModulesRenderer->render() JROOT/libraries/src/Document/HtmlDocument.php:511 6 Joomla\CMS\Document\HtmlDocument->getBuffer() JROOT/libraries/src/Document/HtmlDocument.php:803 5 Joomla\CMS\Document\HtmlDocument->_renderTemplate() JROOT/libraries/src/Document/HtmlDocument.php:577 4 Joomla\CMS\Document\HtmlDocument->render() JROOT/libraries/src/Application/CMSApplication.php:1112 3 Joomla\CMS\Application\CMSApplication->render() JROOT/libraries/src/Application/SiteApplication.php:778 2 Joomla\CMS\Application\SiteApplication->render() JROOT/libraries/src/Application/CMSApplication.php:231 1 Joomla\CMS\Application\CMSApplication->execute() JROOT/index.php:49 - Query Time: 0.64 ms After last query: 0.13 ms Query memory: 0.008 MB Memory before query: 27.645 MB Rows returned: 1
SELECT COUNT(*)
FROM w0v41_k2_items
WHERE MONTH(created)=4
AND YEAR(created)=2019
AND published=1
AND ( publish_up = '0000-00-00 00:00:00' OR publish_up <= '2025-08-29 16:29:05' )
AND ( publish_down = '0000-00-00 00:00:00' OR publish_down >= '2025-08-29 16:29:05' )
AND trash=0
AND access IN(1,1,5)
AND language IN ('en-GB', '*')id select_type table partitions type possible_keys key key_len ref rows filtered Extra 1 SIMPLE w0v41_k2_items NULL range language,idx_item language 21 NULL 71 1.39 Using index condition; Using where No SHOW PROFILE (maybe because there are more than 100 queries)# Caller File and line number 17 JDatabaseDriverMysqli->execute() JROOT/libraries/joomla/database/driver.php:1740 16 JDatabaseDriver->loadResult() JROOT/modules/mod_k2_tools/helper.php:795 15 modK2ToolsHelper::countArchiveItems() JROOT/modules/mod_k2_tools/helper.php:193 14 modK2ToolsHelper::getArchive() JROOT/modules/mod_k2_tools/mod_k2_tools.php:39 13 include JROOT/modules/mod_k2_tools/mod_k2_tools.php JROOT/libraries/src/Helper/ModuleHelper.php:200 12 Joomla\CMS\Helper\ModuleHelper::renderModule() Same as call in the line below. 11 call_user_func_array() JROOT/libraries/src/Cache/Controller/CallbackController.php:173 10 Joomla\CMS\Cache\Controller\CallbackController->get() JROOT/libraries/src/Helper/ModuleHelper.php:617 9 Joomla\CMS\Helper\ModuleHelper::moduleCache() JROOT/libraries/src/Document/Renderer/Html/ModuleRenderer.php:95 8 Joomla\CMS\Document\Renderer\Html\ModuleRenderer->render() JROOT/libraries/src/Document/Renderer/Html/ModulesRenderer.php:47 7 Joomla\CMS\Document\Renderer\Html\ModulesRenderer->render() JROOT/libraries/src/Document/HtmlDocument.php:511 6 Joomla\CMS\Document\HtmlDocument->getBuffer() JROOT/libraries/src/Document/HtmlDocument.php:803 5 Joomla\CMS\Document\HtmlDocument->_renderTemplate() JROOT/libraries/src/Document/HtmlDocument.php:577 4 Joomla\CMS\Document\HtmlDocument->render() JROOT/libraries/src/Application/CMSApplication.php:1112 3 Joomla\CMS\Application\CMSApplication->render() JROOT/libraries/src/Application/SiteApplication.php:778 2 Joomla\CMS\Application\SiteApplication->render() JROOT/libraries/src/Application/CMSApplication.php:231 1 Joomla\CMS\Application\CMSApplication->execute() JROOT/index.php:49 - Query Time: 0.63 ms After last query: 0.13 ms Query memory: 0.008 MB Memory before query: 27.655 MB Rows returned: 1
SELECT COUNT(*)
FROM w0v41_k2_items
WHERE MONTH(created)=3
AND YEAR(created)=2019
AND published=1
AND ( publish_up = '0000-00-00 00:00:00' OR publish_up <= '2025-08-29 16:29:05' )
AND ( publish_down = '0000-00-00 00:00:00' OR publish_down >= '2025-08-29 16:29:05' )
AND trash=0
AND access IN(1,1,5)
AND language IN ('en-GB', '*')id select_type table partitions type possible_keys key key_len ref rows filtered Extra 1 SIMPLE w0v41_k2_items NULL range language,idx_item language 21 NULL 71 1.39 Using index condition; Using where No SHOW PROFILE (maybe because there are more than 100 queries)# Caller File and line number 17 JDatabaseDriverMysqli->execute() JROOT/libraries/joomla/database/driver.php:1740 16 JDatabaseDriver->loadResult() JROOT/modules/mod_k2_tools/helper.php:795 15 modK2ToolsHelper::countArchiveItems() JROOT/modules/mod_k2_tools/helper.php:193 14 modK2ToolsHelper::getArchive() JROOT/modules/mod_k2_tools/mod_k2_tools.php:39 13 include JROOT/modules/mod_k2_tools/mod_k2_tools.php JROOT/libraries/src/Helper/ModuleHelper.php:200 12 Joomla\CMS\Helper\ModuleHelper::renderModule() Same as call in the line below. 11 call_user_func_array() JROOT/libraries/src/Cache/Controller/CallbackController.php:173 10 Joomla\CMS\Cache\Controller\CallbackController->get() JROOT/libraries/src/Helper/ModuleHelper.php:617 9 Joomla\CMS\Helper\ModuleHelper::moduleCache() JROOT/libraries/src/Document/Renderer/Html/ModuleRenderer.php:95 8 Joomla\CMS\Document\Renderer\Html\ModuleRenderer->render() JROOT/libraries/src/Document/Renderer/Html/ModulesRenderer.php:47 7 Joomla\CMS\Document\Renderer\Html\ModulesRenderer->render() JROOT/libraries/src/Document/HtmlDocument.php:511 6 Joomla\CMS\Document\HtmlDocument->getBuffer() JROOT/libraries/src/Document/HtmlDocument.php:803 5 Joomla\CMS\Document\HtmlDocument->_renderTemplate() JROOT/libraries/src/Document/HtmlDocument.php:577 4 Joomla\CMS\Document\HtmlDocument->render() JROOT/libraries/src/Application/CMSApplication.php:1112 3 Joomla\CMS\Application\CMSApplication->render() JROOT/libraries/src/Application/SiteApplication.php:778 2 Joomla\CMS\Application\SiteApplication->render() JROOT/libraries/src/Application/CMSApplication.php:231 1 Joomla\CMS\Application\CMSApplication->execute() JROOT/index.php:49 - Query Time: 0.60 ms After last query: 0.13 ms Query memory: 0.008 MB Memory before query: 27.664 MB Rows returned: 1
SELECT COUNT(*)
FROM w0v41_k2_items
WHERE MONTH(created)=2
AND YEAR(created)=2019
AND published=1
AND ( publish_up = '0000-00-00 00:00:00' OR publish_up <= '2025-08-29 16:29:05' )
AND ( publish_down = '0000-00-00 00:00:00' OR publish_down >= '2025-08-29 16:29:05' )
AND trash=0
AND access IN(1,1,5)
AND language IN ('en-GB', '*')id select_type table partitions type possible_keys key key_len ref rows filtered Extra 1 SIMPLE w0v41_k2_items NULL range language,idx_item language 21 NULL 71 1.39 Using index condition; Using where No SHOW PROFILE (maybe because there are more than 100 queries)# Caller File and line number 17 JDatabaseDriverMysqli->execute() JROOT/libraries/joomla/database/driver.php:1740 16 JDatabaseDriver->loadResult() JROOT/modules/mod_k2_tools/helper.php:795 15 modK2ToolsHelper::countArchiveItems() JROOT/modules/mod_k2_tools/helper.php:193 14 modK2ToolsHelper::getArchive() JROOT/modules/mod_k2_tools/mod_k2_tools.php:39 13 include JROOT/modules/mod_k2_tools/mod_k2_tools.php JROOT/libraries/src/Helper/ModuleHelper.php:200 12 Joomla\CMS\Helper\ModuleHelper::renderModule() Same as call in the line below. 11 call_user_func_array() JROOT/libraries/src/Cache/Controller/CallbackController.php:173 10 Joomla\CMS\Cache\Controller\CallbackController->get() JROOT/libraries/src/Helper/ModuleHelper.php:617 9 Joomla\CMS\Helper\ModuleHelper::moduleCache() JROOT/libraries/src/Document/Renderer/Html/ModuleRenderer.php:95 8 Joomla\CMS\Document\Renderer\Html\ModuleRenderer->render() JROOT/libraries/src/Document/Renderer/Html/ModulesRenderer.php:47 7 Joomla\CMS\Document\Renderer\Html\ModulesRenderer->render() JROOT/libraries/src/Document/HtmlDocument.php:511 6 Joomla\CMS\Document\HtmlDocument->getBuffer() JROOT/libraries/src/Document/HtmlDocument.php:803 5 Joomla\CMS\Document\HtmlDocument->_renderTemplate() JROOT/libraries/src/Document/HtmlDocument.php:577 4 Joomla\CMS\Document\HtmlDocument->render() JROOT/libraries/src/Application/CMSApplication.php:1112 3 Joomla\CMS\Application\CMSApplication->render() JROOT/libraries/src/Application/SiteApplication.php:778 2 Joomla\CMS\Application\SiteApplication->render() JROOT/libraries/src/Application/CMSApplication.php:231 1 Joomla\CMS\Application\CMSApplication->execute() JROOT/index.php:49 - Query Time: 0.60 ms After last query: 0.15 ms Query memory: 0.008 MB Memory before query: 27.673 MB Rows returned: 1
SELECT COUNT(*)
FROM w0v41_k2_items
WHERE MONTH(created)=1
AND YEAR(created)=2019
AND published=1
AND ( publish_up = '0000-00-00 00:00:00' OR publish_up <= '2025-08-29 16:29:05' )
AND ( publish_down = '0000-00-00 00:00:00' OR publish_down >= '2025-08-29 16:29:05' )
AND trash=0
AND access IN(1,1,5)
AND language IN ('en-GB', '*')id select_type table partitions type possible_keys key key_len ref rows filtered Extra 1 SIMPLE w0v41_k2_items NULL range language,idx_item language 21 NULL 71 1.39 Using index condition; Using where No SHOW PROFILE (maybe because there are more than 100 queries)# Caller File and line number 17 JDatabaseDriverMysqli->execute() JROOT/libraries/joomla/database/driver.php:1740 16 JDatabaseDriver->loadResult() JROOT/modules/mod_k2_tools/helper.php:795 15 modK2ToolsHelper::countArchiveItems() JROOT/modules/mod_k2_tools/helper.php:193 14 modK2ToolsHelper::getArchive() JROOT/modules/mod_k2_tools/mod_k2_tools.php:39 13 include JROOT/modules/mod_k2_tools/mod_k2_tools.php JROOT/libraries/src/Helper/ModuleHelper.php:200 12 Joomla\CMS\Helper\ModuleHelper::renderModule() Same as call in the line below. 11 call_user_func_array() JROOT/libraries/src/Cache/Controller/CallbackController.php:173 10 Joomla\CMS\Cache\Controller\CallbackController->get() JROOT/libraries/src/Helper/ModuleHelper.php:617 9 Joomla\CMS\Helper\ModuleHelper::moduleCache() JROOT/libraries/src/Document/Renderer/Html/ModuleRenderer.php:95 8 Joomla\CMS\Document\Renderer\Html\ModuleRenderer->render() JROOT/libraries/src/Document/Renderer/Html/ModulesRenderer.php:47 7 Joomla\CMS\Document\Renderer\Html\ModulesRenderer->render() JROOT/libraries/src/Document/HtmlDocument.php:511 6 Joomla\CMS\Document\HtmlDocument->getBuffer() JROOT/libraries/src/Document/HtmlDocument.php:803 5 Joomla\CMS\Document\HtmlDocument->_renderTemplate() JROOT/libraries/src/Document/HtmlDocument.php:577 4 Joomla\CMS\Document\HtmlDocument->render() JROOT/libraries/src/Application/CMSApplication.php:1112 3 Joomla\CMS\Application\CMSApplication->render() JROOT/libraries/src/Application/SiteApplication.php:778 2 Joomla\CMS\Application\SiteApplication->render() JROOT/libraries/src/Application/CMSApplication.php:231 1 Joomla\CMS\Application\CMSApplication->execute() JROOT/index.php:49 - Query Time: 0.57 ms After last query: 0.13 ms Query memory: 0.008 MB Memory before query: 27.683 MB Rows returned: 1
SELECT COUNT(*)
FROM w0v41_k2_items
WHERE MONTH(created)=1
AND YEAR(created)=2018
AND published=1
AND ( publish_up = '0000-00-00 00:00:00' OR publish_up <= '2025-08-29 16:29:05' )
AND ( publish_down = '0000-00-00 00:00:00' OR publish_down >= '2025-08-29 16:29:05' )
AND trash=0
AND access IN(1,1,5)
AND language IN ('en-GB', '*')id select_type table partitions type possible_keys key key_len ref rows filtered Extra 1 SIMPLE w0v41_k2_items NULL range language,idx_item language 21 NULL 71 1.39 Using index condition; Using where No SHOW PROFILE (maybe because there are more than 100 queries)# Caller File and line number 17 JDatabaseDriverMysqli->execute() JROOT/libraries/joomla/database/driver.php:1740 16 JDatabaseDriver->loadResult() JROOT/modules/mod_k2_tools/helper.php:795 15 modK2ToolsHelper::countArchiveItems() JROOT/modules/mod_k2_tools/helper.php:193 14 modK2ToolsHelper::getArchive() JROOT/modules/mod_k2_tools/mod_k2_tools.php:39 13 include JROOT/modules/mod_k2_tools/mod_k2_tools.php JROOT/libraries/src/Helper/ModuleHelper.php:200 12 Joomla\CMS\Helper\ModuleHelper::renderModule() Same as call in the line below. 11 call_user_func_array() JROOT/libraries/src/Cache/Controller/CallbackController.php:173 10 Joomla\CMS\Cache\Controller\CallbackController->get() JROOT/libraries/src/Helper/ModuleHelper.php:617 9 Joomla\CMS\Helper\ModuleHelper::moduleCache() JROOT/libraries/src/Document/Renderer/Html/ModuleRenderer.php:95 8 Joomla\CMS\Document\Renderer\Html\ModuleRenderer->render() JROOT/libraries/src/Document/Renderer/Html/ModulesRenderer.php:47 7 Joomla\CMS\Document\Renderer\Html\ModulesRenderer->render() JROOT/libraries/src/Document/HtmlDocument.php:511 6 Joomla\CMS\Document\HtmlDocument->getBuffer() JROOT/libraries/src/Document/HtmlDocument.php:803 5 Joomla\CMS\Document\HtmlDocument->_renderTemplate() JROOT/libraries/src/Document/HtmlDocument.php:577 4 Joomla\CMS\Document\HtmlDocument->render() JROOT/libraries/src/Application/CMSApplication.php:1112 3 Joomla\CMS\Application\CMSApplication->render() JROOT/libraries/src/Application/SiteApplication.php:778 2 Joomla\CMS\Application\SiteApplication->render() JROOT/libraries/src/Application/CMSApplication.php:231 1 Joomla\CMS\Application\CMSApplication->execute() JROOT/index.php:49 - Query Time: 0.59 ms After last query: 0.13 ms Query memory: 0.008 MB Memory before query: 27.692 MB Rows returned: 1
SELECT COUNT(*)
FROM w0v41_k2_items
WHERE MONTH(created)=11
AND YEAR(created)=2017
AND published=1
AND ( publish_up = '0000-00-00 00:00:00' OR publish_up <= '2025-08-29 16:29:05' )
AND ( publish_down = '0000-00-00 00:00:00' OR publish_down >= '2025-08-29 16:29:05' )
AND trash=0
AND access IN(1,1,5)
AND language IN ('en-GB', '*')id select_type table partitions type possible_keys key key_len ref rows filtered Extra 1 SIMPLE w0v41_k2_items NULL range language,idx_item language 21 NULL 71 1.39 Using index condition; Using where No SHOW PROFILE (maybe because there are more than 100 queries)# Caller File and line number 17 JDatabaseDriverMysqli->execute() JROOT/libraries/joomla/database/driver.php:1740 16 JDatabaseDriver->loadResult() JROOT/modules/mod_k2_tools/helper.php:795 15 modK2ToolsHelper::countArchiveItems() JROOT/modules/mod_k2_tools/helper.php:193 14 modK2ToolsHelper::getArchive() JROOT/modules/mod_k2_tools/mod_k2_tools.php:39 13 include JROOT/modules/mod_k2_tools/mod_k2_tools.php JROOT/libraries/src/Helper/ModuleHelper.php:200 12 Joomla\CMS\Helper\ModuleHelper::renderModule() Same as call in the line below. 11 call_user_func_array() JROOT/libraries/src/Cache/Controller/CallbackController.php:173 10 Joomla\CMS\Cache\Controller\CallbackController->get() JROOT/libraries/src/Helper/ModuleHelper.php:617 9 Joomla\CMS\Helper\ModuleHelper::moduleCache() JROOT/libraries/src/Document/Renderer/Html/ModuleRenderer.php:95 8 Joomla\CMS\Document\Renderer\Html\ModuleRenderer->render() JROOT/libraries/src/Document/Renderer/Html/ModulesRenderer.php:47 7 Joomla\CMS\Document\Renderer\Html\ModulesRenderer->render() JROOT/libraries/src/Document/HtmlDocument.php:511 6 Joomla\CMS\Document\HtmlDocument->getBuffer() JROOT/libraries/src/Document/HtmlDocument.php:803 5 Joomla\CMS\Document\HtmlDocument->_renderTemplate() JROOT/libraries/src/Document/HtmlDocument.php:577 4 Joomla\CMS\Document\HtmlDocument->render() JROOT/libraries/src/Application/CMSApplication.php:1112 3 Joomla\CMS\Application\CMSApplication->render() JROOT/libraries/src/Application/SiteApplication.php:778 2 Joomla\CMS\Application\SiteApplication->render() JROOT/libraries/src/Application/CMSApplication.php:231 1 Joomla\CMS\Application\CMSApplication->execute() JROOT/index.php:49 - Query Time: 0.58 ms After last query: 0.13 ms Query memory: 0.008 MB Memory before query: 27.702 MB Rows returned: 1
SELECT COUNT(*)
FROM w0v41_k2_items
WHERE MONTH(created)=7
AND YEAR(created)=2017
AND published=1
AND ( publish_up = '0000-00-00 00:00:00' OR publish_up <= '2025-08-29 16:29:05' )
AND ( publish_down = '0000-00-00 00:00:00' OR publish_down >= '2025-08-29 16:29:05' )
AND trash=0
AND access IN(1,1,5)
AND language IN ('en-GB', '*')id select_type table partitions type possible_keys key key_len ref rows filtered Extra 1 SIMPLE w0v41_k2_items NULL range language,idx_item language 21 NULL 71 1.39 Using index condition; Using where No SHOW PROFILE (maybe because there are more than 100 queries)# Caller File and line number 17 JDatabaseDriverMysqli->execute() JROOT/libraries/joomla/database/driver.php:1740 16 JDatabaseDriver->loadResult() JROOT/modules/mod_k2_tools/helper.php:795 15 modK2ToolsHelper::countArchiveItems() JROOT/modules/mod_k2_tools/helper.php:193 14 modK2ToolsHelper::getArchive() JROOT/modules/mod_k2_tools/mod_k2_tools.php:39 13 include JROOT/modules/mod_k2_tools/mod_k2_tools.php JROOT/libraries/src/Helper/ModuleHelper.php:200 12 Joomla\CMS\Helper\ModuleHelper::renderModule() Same as call in the line below. 11 call_user_func_array() JROOT/libraries/src/Cache/Controller/CallbackController.php:173 10 Joomla\CMS\Cache\Controller\CallbackController->get() JROOT/libraries/src/Helper/ModuleHelper.php:617 9 Joomla\CMS\Helper\ModuleHelper::moduleCache() JROOT/libraries/src/Document/Renderer/Html/ModuleRenderer.php:95 8 Joomla\CMS\Document\Renderer\Html\ModuleRenderer->render() JROOT/libraries/src/Document/Renderer/Html/ModulesRenderer.php:47 7 Joomla\CMS\Document\Renderer\Html\ModulesRenderer->render() JROOT/libraries/src/Document/HtmlDocument.php:511 6 Joomla\CMS\Document\HtmlDocument->getBuffer() JROOT/libraries/src/Document/HtmlDocument.php:803 5 Joomla\CMS\Document\HtmlDocument->_renderTemplate() JROOT/libraries/src/Document/HtmlDocument.php:577 4 Joomla\CMS\Document\HtmlDocument->render() JROOT/libraries/src/Application/CMSApplication.php:1112 3 Joomla\CMS\Application\CMSApplication->render() JROOT/libraries/src/Application/SiteApplication.php:778 2 Joomla\CMS\Application\SiteApplication->render() JROOT/libraries/src/Application/CMSApplication.php:231 1 Joomla\CMS\Application\CMSApplication->execute() JROOT/index.php:49 - Query Time: 0.57 ms After last query: 0.13 ms Query memory: 0.008 MB Memory before query: 27.712 MB Rows returned: 1
SELECT COUNT(*)
FROM w0v41_k2_items
WHERE MONTH(created)=5
AND YEAR(created)=2017
AND published=1
AND ( publish_up = '0000-00-00 00:00:00' OR publish_up <= '2025-08-29 16:29:05' )
AND ( publish_down = '0000-00-00 00:00:00' OR publish_down >= '2025-08-29 16:29:05' )
AND trash=0
AND access IN(1,1,5)
AND language IN ('en-GB', '*')id select_type table partitions type possible_keys key key_len ref rows filtered Extra 1 SIMPLE w0v41_k2_items NULL range language,idx_item language 21 NULL 71 1.39 Using index condition; Using where Status Duration starting 0.07 ms Executing hook on transaction 0.00 ms starting 0.01 ms checking permissions 0.01 ms Opening tables 0.03 ms init 0.01 ms System lock 0.01 ms optimizing 0.02 ms statistics 0.06 ms preparing 0.02 ms executing 0.24 ms end 0.01 ms query end 0.00 ms waiting for handler commit 0.01 ms closing tables 0.01 ms freeing items 0.05 ms cleaning up 0.01 ms # Caller File and line number 17 JDatabaseDriverMysqli->execute() JROOT/libraries/joomla/database/driver.php:1740 16 JDatabaseDriver->loadResult() JROOT/modules/mod_k2_tools/helper.php:795 15 modK2ToolsHelper::countArchiveItems() JROOT/modules/mod_k2_tools/helper.php:193 14 modK2ToolsHelper::getArchive() JROOT/modules/mod_k2_tools/mod_k2_tools.php:39 13 include JROOT/modules/mod_k2_tools/mod_k2_tools.php JROOT/libraries/src/Helper/ModuleHelper.php:200 12 Joomla\CMS\Helper\ModuleHelper::renderModule() Same as call in the line below. 11 call_user_func_array() JROOT/libraries/src/Cache/Controller/CallbackController.php:173 10 Joomla\CMS\Cache\Controller\CallbackController->get() JROOT/libraries/src/Helper/ModuleHelper.php:617 9 Joomla\CMS\Helper\ModuleHelper::moduleCache() JROOT/libraries/src/Document/Renderer/Html/ModuleRenderer.php:95 8 Joomla\CMS\Document\Renderer\Html\ModuleRenderer->render() JROOT/libraries/src/Document/Renderer/Html/ModulesRenderer.php:47 7 Joomla\CMS\Document\Renderer\Html\ModulesRenderer->render() JROOT/libraries/src/Document/HtmlDocument.php:511 6 Joomla\CMS\Document\HtmlDocument->getBuffer() JROOT/libraries/src/Document/HtmlDocument.php:803 5 Joomla\CMS\Document\HtmlDocument->_renderTemplate() JROOT/libraries/src/Document/HtmlDocument.php:577 4 Joomla\CMS\Document\HtmlDocument->render() JROOT/libraries/src/Application/CMSApplication.php:1112 3 Joomla\CMS\Application\CMSApplication->render() JROOT/libraries/src/Application/SiteApplication.php:778 2 Joomla\CMS\Application\SiteApplication->render() JROOT/libraries/src/Application/CMSApplication.php:231 1 Joomla\CMS\Application\CMSApplication->execute() JROOT/index.php:49 - Query Time: 0.66 ms After last query: 0.14 ms Query memory: 0.008 MB Memory before query: 27.721 MB Rows returned: 1
SELECT COUNT(*)
FROM w0v41_k2_items
WHERE MONTH(created)=4
AND YEAR(created)=2017
AND published=1
AND ( publish_up = '0000-00-00 00:00:00' OR publish_up <= '2025-08-29 16:29:05' )
AND ( publish_down = '0000-00-00 00:00:00' OR publish_down >= '2025-08-29 16:29:05' )
AND trash=0
AND access IN(1,1,5)
AND language IN ('en-GB', '*')id select_type table partitions type possible_keys key key_len ref rows filtered Extra 1 SIMPLE w0v41_k2_items NULL range language,idx_item language 21 NULL 71 1.39 Using index condition; Using where Status Duration starting 0.10 ms Executing hook on transaction 0.01 ms starting 0.01 ms checking permissions 0.01 ms Opening tables 0.03 ms init 0.01 ms System lock 0.01 ms optimizing 0.03 ms statistics 0.07 ms preparing 0.02 ms executing 0.26 ms end 0.01 ms query end 0.00 ms waiting for handler commit 0.01 ms closing tables 0.01 ms freeing items 0.06 ms cleaning up 0.01 ms # Caller File and line number 17 JDatabaseDriverMysqli->execute() JROOT/libraries/joomla/database/driver.php:1740 16 JDatabaseDriver->loadResult() JROOT/modules/mod_k2_tools/helper.php:795 15 modK2ToolsHelper::countArchiveItems() JROOT/modules/mod_k2_tools/helper.php:193 14 modK2ToolsHelper::getArchive() JROOT/modules/mod_k2_tools/mod_k2_tools.php:39 13 include JROOT/modules/mod_k2_tools/mod_k2_tools.php JROOT/libraries/src/Helper/ModuleHelper.php:200 12 Joomla\CMS\Helper\ModuleHelper::renderModule() Same as call in the line below. 11 call_user_func_array() JROOT/libraries/src/Cache/Controller/CallbackController.php:173 10 Joomla\CMS\Cache\Controller\CallbackController->get() JROOT/libraries/src/Helper/ModuleHelper.php:617 9 Joomla\CMS\Helper\ModuleHelper::moduleCache() JROOT/libraries/src/Document/Renderer/Html/ModuleRenderer.php:95 8 Joomla\CMS\Document\Renderer\Html\ModuleRenderer->render() JROOT/libraries/src/Document/Renderer/Html/ModulesRenderer.php:47 7 Joomla\CMS\Document\Renderer\Html\ModulesRenderer->render() JROOT/libraries/src/Document/HtmlDocument.php:511 6 Joomla\CMS\Document\HtmlDocument->getBuffer() JROOT/libraries/src/Document/HtmlDocument.php:803 5 Joomla\CMS\Document\HtmlDocument->_renderTemplate() JROOT/libraries/src/Document/HtmlDocument.php:577 4 Joomla\CMS\Document\HtmlDocument->render() JROOT/libraries/src/Application/CMSApplication.php:1112 3 Joomla\CMS\Application\CMSApplication->render() JROOT/libraries/src/Application/SiteApplication.php:778 2 Joomla\CMS\Application\SiteApplication->render() JROOT/libraries/src/Application/CMSApplication.php:231 1 Joomla\CMS\Application\CMSApplication->execute() JROOT/index.php:49 - Query Time: 0.64 ms After last query: 0.14 ms Query memory: 0.008 MB Memory before query: 27.730 MB Rows returned: 1
SELECT COUNT(*)
FROM w0v41_k2_items
WHERE MONTH(created)=2
AND YEAR(created)=2017
AND published=1
AND ( publish_up = '0000-00-00 00:00:00' OR publish_up <= '2025-08-29 16:29:05' )
AND ( publish_down = '0000-00-00 00:00:00' OR publish_down >= '2025-08-29 16:29:05' )
AND trash=0
AND access IN(1,1,5)
AND language IN ('en-GB', '*')id select_type table partitions type possible_keys key key_len ref rows filtered Extra 1 SIMPLE w0v41_k2_items NULL range language,idx_item language 21 NULL 71 1.39 Using index condition; Using where Status Duration starting 0.09 ms Executing hook on transaction 0.01 ms starting 0.01 ms checking permissions 0.01 ms Opening tables 0.03 ms init 0.01 ms System lock 0.01 ms optimizing 0.03 ms statistics 0.06 ms preparing 0.02 ms executing 0.25 ms end 0.01 ms query end 0.00 ms waiting for handler commit 0.01 ms closing tables 0.01 ms freeing items 0.06 ms cleaning up 0.01 ms # Caller File and line number 17 JDatabaseDriverMysqli->execute() JROOT/libraries/joomla/database/driver.php:1740 16 JDatabaseDriver->loadResult() JROOT/modules/mod_k2_tools/helper.php:795 15 modK2ToolsHelper::countArchiveItems() JROOT/modules/mod_k2_tools/helper.php:193 14 modK2ToolsHelper::getArchive() JROOT/modules/mod_k2_tools/mod_k2_tools.php:39 13 include JROOT/modules/mod_k2_tools/mod_k2_tools.php JROOT/libraries/src/Helper/ModuleHelper.php:200 12 Joomla\CMS\Helper\ModuleHelper::renderModule() Same as call in the line below. 11 call_user_func_array() JROOT/libraries/src/Cache/Controller/CallbackController.php:173 10 Joomla\CMS\Cache\Controller\CallbackController->get() JROOT/libraries/src/Helper/ModuleHelper.php:617 9 Joomla\CMS\Helper\ModuleHelper::moduleCache() JROOT/libraries/src/Document/Renderer/Html/ModuleRenderer.php:95 8 Joomla\CMS\Document\Renderer\Html\ModuleRenderer->render() JROOT/libraries/src/Document/Renderer/Html/ModulesRenderer.php:47 7 Joomla\CMS\Document\Renderer\Html\ModulesRenderer->render() JROOT/libraries/src/Document/HtmlDocument.php:511 6 Joomla\CMS\Document\HtmlDocument->getBuffer() JROOT/libraries/src/Document/HtmlDocument.php:803 5 Joomla\CMS\Document\HtmlDocument->_renderTemplate() JROOT/libraries/src/Document/HtmlDocument.php:577 4 Joomla\CMS\Document\HtmlDocument->render() JROOT/libraries/src/Application/CMSApplication.php:1112 3 Joomla\CMS\Application\CMSApplication->render() JROOT/libraries/src/Application/SiteApplication.php:778 2 Joomla\CMS\Application\SiteApplication->render() JROOT/libraries/src/Application/CMSApplication.php:231 1 Joomla\CMS\Application\CMSApplication->execute() JROOT/index.php:49 - Query Time: 1.91 ms After last query: 3.89 ms Query memory: 0.007 MB Memory before query: 27.815 MB Rows returned: 5Duplicate queries: #92
/* Frontend / mod_k2_content */ SELECT i.*, c.name AS categoryname, c.id AS categoryid, c.alias AS categoryalias, c.params AS categoryparams
FROM w0v41_k2_items AS i
INNER JOIN w0v41_k2_categories AS c
ON c.id = i.catid
WHERE i.published = 1
AND i.access IN(1,5)
AND i.trash = 0
AND c.published = 1
AND c.access IN(1,5)
AND c.trash = 0
AND (i.publish_up = '0000-00-00 00:00:00' OR i.publish_up <= '2025-08-29 16:29:05')
AND (i.publish_down = '0000-00-00 00:00:00' OR i.publish_down >= '2025-08-29 16:29:05')
AND i.language IN('en-GB', '*')
AND c.language IN('en-GB', '*')
ORDER BY i.id DESC
LIMIT 0, 5EXPLAIN not possible on query: /* Frontend / mod_k2_content */ SELECT i.*, c.name AS categoryname, c.id AS categoryid, c.alias AS categoryalias, c.params AS categoryparams FROM w0v41_k2_items AS i INNER JOIN w0v41_k2_categories AS c ON c.id = i.catid WHERE i.published = 1 AND i.access IN(1,5) AND i.trash = 0 AND c.published = 1 AND c.access IN(1,5) AND c.trash = 0 AND (i.publish_up = '0000-00-00 00:00:00' OR i.publish_up <= '2025-08-29 16:29:05') AND (i.publish_down = '0000-00-00 00:00:00' OR i.publish_down >= '2025-08-29 16:29:05') AND i.language IN('en-GB', '*') AND c.language IN('en-GB', '*') ORDER BY i.id DESC LIMIT 0, 5Status Duration starting 0.14 ms Executing hook on transaction 0.01 ms starting 0.01 ms checking permissions 0.01 ms checking permissions 0.01 ms Opening tables 0.06 ms init 0.01 ms System lock 0.01 ms optimizing 0.03 ms statistics 0.15 ms preparing 0.02 ms Creating tmp table 0.07 ms executing 1.29 ms end 0.01 ms query end 0.00 ms waiting for handler commit 0.01 ms closing tables 0.01 ms freeing items 0.06 ms cleaning up 0.01 ms # Caller File and line number 16 JDatabaseDriverMysqli->execute() JROOT/libraries/joomla/database/driver.php:1701 15 JDatabaseDriver->loadObjectList() JROOT/modules/mod_k2_content/helper.php:252 14 modK2ContentHelper::getItems() JROOT/modules/mod_k2_content/mod_k2_content.php:65 13 include JROOT/modules/mod_k2_content/mod_k2_content.php JROOT/libraries/src/Helper/ModuleHelper.php:200 12 Joomla\CMS\Helper\ModuleHelper::renderModule() Same as call in the line below. 11 call_user_func_array() JROOT/libraries/src/Cache/Controller/CallbackController.php:173 10 Joomla\CMS\Cache\Controller\CallbackController->get() JROOT/libraries/src/Helper/ModuleHelper.php:617 9 Joomla\CMS\Helper\ModuleHelper::moduleCache() JROOT/libraries/src/Document/Renderer/Html/ModuleRenderer.php:95 8 Joomla\CMS\Document\Renderer\Html\ModuleRenderer->render() JROOT/libraries/src/Document/Renderer/Html/ModulesRenderer.php:47 7 Joomla\CMS\Document\Renderer\Html\ModulesRenderer->render() JROOT/libraries/src/Document/HtmlDocument.php:511 6 Joomla\CMS\Document\HtmlDocument->getBuffer() JROOT/libraries/src/Document/HtmlDocument.php:803 5 Joomla\CMS\Document\HtmlDocument->_renderTemplate() JROOT/libraries/src/Document/HtmlDocument.php:577 4 Joomla\CMS\Document\HtmlDocument->render() JROOT/libraries/src/Application/CMSApplication.php:1112 3 Joomla\CMS\Application\CMSApplication->render() JROOT/libraries/src/Application/SiteApplication.php:778 2 Joomla\CMS\Application\SiteApplication->render() JROOT/libraries/src/Application/CMSApplication.php:231 1 Joomla\CMS\Application\CMSApplication->execute() JROOT/index.php:49 - Query Time: 2.71 ms After last query: 5.02 ms Query memory: 0.007 MB Memory before query: 27.883 MB Rows returned: 0
SELECT c.*, i.catid, i.title, i.alias, category.alias AS catalias, category.name AS categoryname
FROM w0v41_k2_comments AS c
LEFT JOIN w0v41_k2_items AS i
ON i.id = c.itemID
LEFT JOIN w0v41_k2_categories AS category
ON category.id = i.catid
WHERE i.published = 1
AND (i.publish_up = '0000-00-00 00:00:00' OR i.publish_up <= '2025-08-29 16:29:05')
AND (i.publish_down = '0000-00-00 00:00:00' OR i.publish_down >= '2025-08-29 16:29:05')
AND i.trash = 0
AND i.access IN(1,5)
AND category.published = 1
AND category.trash = 0
AND category.access IN(1,5)
AND c.published = 1
AND i.language IN ('en-GB', '*')
AND category.language IN ('en-GB', '*')
ORDER BY c.id DESC
LIMIT 0, 5id select_type table partitions type possible_keys key key_len ref rows filtered Extra 1 SIMPLE c NULL ref itemID,published,latestComments,countComments published 4 const 1 100.00 Backward index scan 1 SIMPLE i NULL eq_ref PRIMARY,catid,language,idx_item PRIMARY 4 h88876_SDAT.c.itemID 1 5.00 Using where 1 SIMPLE category NULL eq_ref PRIMARY,category,published,access,trash,language,idx_category PRIMARY 4 h88876_SDAT.i.catid 1 57.14 Using where Status Duration starting 0.17 ms Executing hook on transaction 0.01 ms starting 0.01 ms checking permissions 0.01 ms checking permissions 0.00 ms checking permissions 0.00 ms Opening tables 1.91 ms init 0.01 ms System lock 0.01 ms optimizing 0.04 ms statistics 0.22 ms preparing 0.04 ms executing 0.03 ms end 0.01 ms query end 0.00 ms waiting for handler commit 0.01 ms closing tables 0.09 ms freeing items 0.07 ms cleaning up 0.01 ms # Caller File and line number 16 JDatabaseDriverMysqli->execute() JROOT/libraries/joomla/database/driver.php:1701 15 JDatabaseDriver->loadObjectList() JROOT/modules/mod_k2_comments/helper.php:92 14 modK2CommentsHelper::getLatestComments() JROOT/modules/mod_k2_comments/mod_k2_comments.php:49 13 include JROOT/modules/mod_k2_comments/mod_k2_comments.php JROOT/libraries/src/Helper/ModuleHelper.php:200 12 Joomla\CMS\Helper\ModuleHelper::renderModule() Same as call in the line below. 11 call_user_func_array() JROOT/libraries/src/Cache/Controller/CallbackController.php:173 10 Joomla\CMS\Cache\Controller\CallbackController->get() JROOT/libraries/src/Helper/ModuleHelper.php:617 9 Joomla\CMS\Helper\ModuleHelper::moduleCache() JROOT/libraries/src/Document/Renderer/Html/ModuleRenderer.php:95 8 Joomla\CMS\Document\Renderer\Html\ModuleRenderer->render() JROOT/libraries/src/Document/Renderer/Html/ModulesRenderer.php:47 7 Joomla\CMS\Document\Renderer\Html\ModulesRenderer->render() JROOT/libraries/src/Document/HtmlDocument.php:511 6 Joomla\CMS\Document\HtmlDocument->getBuffer() JROOT/libraries/src/Document/HtmlDocument.php:803 5 Joomla\CMS\Document\HtmlDocument->_renderTemplate() JROOT/libraries/src/Document/HtmlDocument.php:577 4 Joomla\CMS\Document\HtmlDocument->render() JROOT/libraries/src/Application/CMSApplication.php:1112 3 Joomla\CMS\Application\CMSApplication->render() JROOT/libraries/src/Application/SiteApplication.php:778 2 Joomla\CMS\Application\SiteApplication->render() JROOT/libraries/src/Application/CMSApplication.php:231 1 Joomla\CMS\Application\CMSApplication->execute() JROOT/index.php:49 - Query Time: 1.96 ms After last query: 2.79 ms Query memory: 0.007 MB Memory before query: 27.902 MB Rows returned: 5Duplicate queries: #90
/* Frontend / mod_k2_content */ SELECT i.*, c.name AS categoryname, c.id AS categoryid, c.alias AS categoryalias, c.params AS categoryparams
FROM w0v41_k2_items AS i
INNER JOIN w0v41_k2_categories AS c
ON c.id = i.catid
WHERE i.published = 1
AND i.access IN(1,5)
AND i.trash = 0
AND c.published = 1
AND c.access IN(1,5)
AND c.trash = 0
AND (i.publish_up = '0000-00-00 00:00:00' OR i.publish_up <= '2025-08-29 16:29:05')
AND (i.publish_down = '0000-00-00 00:00:00' OR i.publish_down >= '2025-08-29 16:29:05')
AND i.language IN('en-GB', '*')
AND c.language IN('en-GB', '*')
ORDER BY i.id DESC
LIMIT 0, 5EXPLAIN not possible on query: /* Frontend / mod_k2_content */ SELECT i.*, c.name AS categoryname, c.id AS categoryid, c.alias AS categoryalias, c.params AS categoryparams FROM w0v41_k2_items AS i INNER JOIN w0v41_k2_categories AS c ON c.id = i.catid WHERE i.published = 1 AND i.access IN(1,5) AND i.trash = 0 AND c.published = 1 AND c.access IN(1,5) AND c.trash = 0 AND (i.publish_up = '0000-00-00 00:00:00' OR i.publish_up <= '2025-08-29 16:29:05') AND (i.publish_down = '0000-00-00 00:00:00' OR i.publish_down >= '2025-08-29 16:29:05') AND i.language IN('en-GB', '*') AND c.language IN('en-GB', '*') ORDER BY i.id DESC LIMIT 0, 5Status Duration starting 0.24 ms Executing hook on transaction 0.01 ms starting 0.01 ms checking permissions 0.01 ms checking permissions 0.01 ms Opening tables 0.08 ms init 0.01 ms System lock 0.01 ms optimizing 0.03 ms statistics 0.20 ms preparing 0.03 ms Creating tmp table 0.07 ms executing 1.12 ms end 0.01 ms query end 0.01 ms waiting for handler commit 0.02 ms closing tables 0.01 ms freeing items 0.07 ms cleaning up 0.01 ms # Caller File and line number 16 JDatabaseDriverMysqli->execute() JROOT/libraries/joomla/database/driver.php:1701 15 JDatabaseDriver->loadObjectList() JROOT/modules/mod_k2_content/helper.php:252 14 modK2ContentHelper::getItems() JROOT/modules/mod_k2_content/mod_k2_content.php:65 13 include JROOT/modules/mod_k2_content/mod_k2_content.php JROOT/libraries/src/Helper/ModuleHelper.php:200 12 Joomla\CMS\Helper\ModuleHelper::renderModule() Same as call in the line below. 11 call_user_func_array() JROOT/libraries/src/Cache/Controller/CallbackController.php:173 10 Joomla\CMS\Cache\Controller\CallbackController->get() JROOT/libraries/src/Helper/ModuleHelper.php:617 9 Joomla\CMS\Helper\ModuleHelper::moduleCache() JROOT/libraries/src/Document/Renderer/Html/ModuleRenderer.php:95 8 Joomla\CMS\Document\Renderer\Html\ModuleRenderer->render() JROOT/libraries/src/Document/Renderer/Html/ModulesRenderer.php:47 7 Joomla\CMS\Document\Renderer\Html\ModulesRenderer->render() JROOT/libraries/src/Document/HtmlDocument.php:511 6 Joomla\CMS\Document\HtmlDocument->getBuffer() JROOT/libraries/src/Document/HtmlDocument.php:803 5 Joomla\CMS\Document\HtmlDocument->_renderTemplate() JROOT/libraries/src/Document/HtmlDocument.php:577 4 Joomla\CMS\Document\HtmlDocument->render() JROOT/libraries/src/Application/CMSApplication.php:1112 3 Joomla\CMS\Application\CMSApplication->render() JROOT/libraries/src/Application/SiteApplication.php:778 2 Joomla\CMS\Application\SiteApplication->render() JROOT/libraries/src/Application/CMSApplication.php:231 1 Joomla\CMS\Application\CMSApplication->execute() JROOT/index.php:49 - Query Time: 0.46 ms After last query: 0.21 ms Query memory: 0.008 MB Memory before query: 27.969 MB Rows returned: 3
SELECT tag.*
FROM w0v41_k2_tags AS tag JOIN w0v41_k2_tags_xref AS xref
ON tag.id = xref.tagID
WHERE tag.published = 1
AND xref.itemID = 99
ORDER BY xref.id ASCid select_type table partitions type possible_keys key key_len ref rows filtered Extra 1 SIMPLE xref NULL ref tagID,itemID itemID 4 const 3 100.00 NULL 1 SIMPLE tag NULL eq_ref PRIMARY,published PRIMARY 4 h88876_SDAT.xref.tagID 1 100.00 Using where Status Duration starting 0.13 ms Executing hook on transaction 0.01 ms starting 0.01 ms checking permissions 0.00 ms checking permissions 0.00 ms Opening tables 0.04 ms init 0.01 ms System lock 0.01 ms optimizing 0.01 ms statistics 0.06 ms preparing 0.02 ms executing 0.06 ms end 0.01 ms query end 0.01 ms waiting for handler commit 0.01 ms closing tables 0.01 ms freeing items 0.06 ms cleaning up 0.01 ms # Caller File and line number 17 JDatabaseDriverMysqli->execute() JROOT/libraries/joomla/database/driver.php:1701 16 JDatabaseDriver->loadObjectList() JROOT/components/com_k2/models/item.php:1201 15 K2ModelItem->getItemTags() JROOT/modules/mod_k2_content/helper.php:303 14 modK2ContentHelper::getItems() JROOT/modules/mod_k2_content/mod_k2_content.php:65 13 include JROOT/modules/mod_k2_content/mod_k2_content.php JROOT/libraries/src/Helper/ModuleHelper.php:200 12 Joomla\CMS\Helper\ModuleHelper::renderModule() Same as call in the line below. 11 call_user_func_array() JROOT/libraries/src/Cache/Controller/CallbackController.php:173 10 Joomla\CMS\Cache\Controller\CallbackController->get() JROOT/libraries/src/Helper/ModuleHelper.php:617 9 Joomla\CMS\Helper\ModuleHelper::moduleCache() JROOT/libraries/src/Document/Renderer/Html/ModuleRenderer.php:95 8 Joomla\CMS\Document\Renderer\Html\ModuleRenderer->render() JROOT/libraries/src/Document/Renderer/Html/ModulesRenderer.php:47 7 Joomla\CMS\Document\Renderer\Html\ModulesRenderer->render() JROOT/libraries/src/Document/HtmlDocument.php:511 6 Joomla\CMS\Document\HtmlDocument->getBuffer() JROOT/libraries/src/Document/HtmlDocument.php:803 5 Joomla\CMS\Document\HtmlDocument->_renderTemplate() JROOT/libraries/src/Document/HtmlDocument.php:577 4 Joomla\CMS\Document\HtmlDocument->render() JROOT/libraries/src/Application/CMSApplication.php:1112 3 Joomla\CMS\Application\CMSApplication->render() JROOT/libraries/src/Application/SiteApplication.php:778 2 Joomla\CMS\Application\SiteApplication->render() JROOT/libraries/src/Application/CMSApplication.php:231 1 Joomla\CMS\Application\CMSApplication->execute() JROOT/index.php:49 - Query Time: 0.81 ms After last query: 1.14 ms Query memory: 0.010 MB Memory before query: 27.985 MB Rows returned: 0
SELECT DISTINCT a.id, a.title, a.name, a.checked_out, a.checked_out_time, a.note, a.state, a.access, a.created_time, a.created_user_id, a.ordering, a.language, a.fieldparams, a.params, a.type, a.default_value, a.context, a.group_id, a.label, a.description, a.required,l.title AS language_title, l.image AS language_image,uc.name AS editor,ag.title AS access_level,ua.name AS author_name,g.title AS group_title, g.access as group_access, g.state AS group_state, g.note as group_note
FROM w0v41_fields AS a
LEFT JOIN `w0v41_languages` AS l
ON l.lang_code = a.language
LEFT JOIN w0v41_users AS uc
ON uc.id=a.checked_out
LEFT JOIN w0v41_viewlevels AS ag
ON ag.id = a.access
LEFT JOIN w0v41_users AS ua
ON ua.id = a.created_user_id
LEFT JOIN w0v41_fields_groups AS g
ON g.id = a.group_id
WHERE a.context = 'mod_k2_content.item-media'
AND a.access IN (1,1,5)
AND (a.group_id = 0 OR g.access IN (1,1,5))
AND a.state = 1
AND (a.group_id = 0 OR g.state = 1)
AND a.language in ('*','en-GB')
ORDER BY a.ordering ASCid select_type table partitions type possible_keys key key_len ref rows filtered Extra 1 SIMPLE a NULL ref idx_state,idx_access,idx_context,idx_language idx_state 1 const 1 100.00 Using where; Using temporary; Using filesort 1 SIMPLE l NULL eq_ref idx_langcode idx_langcode 28 h88876_SDAT.a.language 1 100.00 Using index condition 1 SIMPLE uc NULL eq_ref PRIMARY PRIMARY 4 h88876_SDAT.a.checked_out 1 100.00 NULL 1 SIMPLE ag NULL eq_ref PRIMARY PRIMARY 4 h88876_SDAT.a.access 1 100.00 Using where 1 SIMPLE ua NULL eq_ref PRIMARY PRIMARY 4 h88876_SDAT.a.created_user_id 1 100.00 Using where 1 SIMPLE g NULL eq_ref PRIMARY PRIMARY 4 h88876_SDAT.a.group_id 1 100.00 Using where Status Duration starting 0.15 ms Executing hook on transaction 0.01 ms starting 0.01 ms checking permissions 0.01 ms checking permissions 0.00 ms checking permissions 0.00 ms checking permissions 0.00 ms checking permissions 0.00 ms checking permissions 0.01 ms Opening tables 0.11 ms init 0.01 ms System lock 0.01 ms optimizing 0.02 ms statistics 0.18 ms preparing 0.03 ms Creating tmp table 0.07 ms executing 0.06 ms end 0.01 ms query end 0.00 ms waiting for handler commit 0.01 ms closing tables 0.01 ms freeing items 0.06 ms cleaning up 0.01 ms # Caller File and line number 23 JDatabaseDriverMysqli->execute() JROOT/libraries/joomla/database/driver.php:1701 22 JDatabaseDriver->loadObjectList() JROOT/libraries/src/MVC/Model/BaseDatabaseModel.php:322 21 Joomla\CMS\MVC\Model\BaseDatabaseModel->_getList() JROOT/administrator/components/com_fields/models/fields.php:333 20 FieldsModelFields->_getList() JROOT/libraries/src/MVC/Model/ListModel.php:194 19 Joomla\CMS\MVC\Model\ListModel->getItems() JROOT/administrator/components/com_fields/helpers/fields.php:136 18 FieldsHelper::getFields() JROOT/plugins/system/fields/fields.php:495 17 PlgSystemFields->onContentPrepare() JROOT/libraries/joomla/event/event.php:70 16 JEvent->update() JROOT/libraries/joomla/event/dispatcher.php:160 15 JEventDispatcher->trigger() JROOT/modules/mod_k2_content/helper.php:381 14 modK2ContentHelper::getItems() JROOT/modules/mod_k2_content/mod_k2_content.php:65 13 include JROOT/modules/mod_k2_content/mod_k2_content.php JROOT/libraries/src/Helper/ModuleHelper.php:200 12 Joomla\CMS\Helper\ModuleHelper::renderModule() Same as call in the line below. 11 call_user_func_array() JROOT/libraries/src/Cache/Controller/CallbackController.php:173 10 Joomla\CMS\Cache\Controller\CallbackController->get() JROOT/libraries/src/Helper/ModuleHelper.php:617 9 Joomla\CMS\Helper\ModuleHelper::moduleCache() JROOT/libraries/src/Document/Renderer/Html/ModuleRenderer.php:95 8 Joomla\CMS\Document\Renderer\Html\ModuleRenderer->render() JROOT/libraries/src/Document/Renderer/Html/ModulesRenderer.php:47 7 Joomla\CMS\Document\Renderer\Html\ModulesRenderer->render() JROOT/libraries/src/Document/HtmlDocument.php:511 6 Joomla\CMS\Document\HtmlDocument->getBuffer() JROOT/libraries/src/Document/HtmlDocument.php:803 5 Joomla\CMS\Document\HtmlDocument->_renderTemplate() JROOT/libraries/src/Document/HtmlDocument.php:577 4 Joomla\CMS\Document\HtmlDocument->render() JROOT/libraries/src/Application/CMSApplication.php:1112 3 Joomla\CMS\Application\CMSApplication->render() JROOT/libraries/src/Application/SiteApplication.php:778 2 Joomla\CMS\Application\SiteApplication->render() JROOT/libraries/src/Application/CMSApplication.php:231 1 Joomla\CMS\Application\CMSApplication->execute() JROOT/index.php:49 - Query Time: 1.77 ms After last query: 0.49 ms Query memory: 0.008 MB Memory before query: 28.009 MB Rows returned: 0
SELECT *
FROM w0v41_k2_attachments
WHERE itemID=99id select_type table partitions type possible_keys key key_len ref rows filtered Extra 1 SIMPLE w0v41_k2_attachments NULL ref itemID itemID 4 const 1 100.00 NULL Status Duration starting 0.08 ms Executing hook on transaction 0.01 ms starting 0.01 ms checking permissions 0.01 ms Opening tables 1.43 ms init 0.01 ms System lock 0.01 ms optimizing 0.01 ms statistics 0.03 ms preparing 0.01 ms executing 0.02 ms end 0.01 ms query end 0.00 ms waiting for handler commit 0.01 ms closing tables 0.06 ms freeing items 0.06 ms cleaning up 0.01 ms # Caller File and line number 17 JDatabaseDriverMysqli->execute() JROOT/libraries/joomla/database/driver.php:1701 16 JDatabaseDriver->loadObjectList() JROOT/components/com_k2/models/item.php:1429 15 K2ModelItem->getItemAttachments() JROOT/modules/mod_k2_content/helper.php:437 14 modK2ContentHelper::getItems() JROOT/modules/mod_k2_content/mod_k2_content.php:65 13 include JROOT/modules/mod_k2_content/mod_k2_content.php JROOT/libraries/src/Helper/ModuleHelper.php:200 12 Joomla\CMS\Helper\ModuleHelper::renderModule() Same as call in the line below. 11 call_user_func_array() JROOT/libraries/src/Cache/Controller/CallbackController.php:173 10 Joomla\CMS\Cache\Controller\CallbackController->get() JROOT/libraries/src/Helper/ModuleHelper.php:617 9 Joomla\CMS\Helper\ModuleHelper::moduleCache() JROOT/libraries/src/Document/Renderer/Html/ModuleRenderer.php:95 8 Joomla\CMS\Document\Renderer\Html\ModuleRenderer->render() JROOT/libraries/src/Document/Renderer/Html/ModulesRenderer.php:47 7 Joomla\CMS\Document\Renderer\Html\ModulesRenderer->render() JROOT/libraries/src/Document/HtmlDocument.php:511 6 Joomla\CMS\Document\HtmlDocument->getBuffer() JROOT/libraries/src/Document/HtmlDocument.php:803 5 Joomla\CMS\Document\HtmlDocument->_renderTemplate() JROOT/libraries/src/Document/HtmlDocument.php:577 4 Joomla\CMS\Document\HtmlDocument->render() JROOT/libraries/src/Application/CMSApplication.php:1112 3 Joomla\CMS\Application\CMSApplication->render() JROOT/libraries/src/Application/SiteApplication.php:778 2 Joomla\CMS\Application\SiteApplication->render() JROOT/libraries/src/Application/CMSApplication.php:231 1 Joomla\CMS\Application\CMSApplication->execute() JROOT/index.php:49 - Query Time: 0.34 ms After last query: 0.05 ms Query memory: 0.008 MB Memory before query: 28.017 MB Rows returned: 1
SELECT COUNT(*)
FROM w0v41_k2_comments
WHERE itemID=99
AND published=1id select_type table partitions type possible_keys key key_len ref rows filtered Extra 1 SIMPLE w0v41_k2_comments NULL ref itemID,published,latestComments,countComments countComments 8 const,const 1 100.00 Using index Status Duration starting 0.08 ms Executing hook on transaction 0.01 ms starting 0.01 ms checking permissions 0.01 ms Opening tables 0.02 ms init 0.01 ms System lock 0.01 ms optimizing 0.01 ms statistics 0.07 ms preparing 0.02 ms executing 0.02 ms end 0.00 ms query end 0.00 ms waiting for handler commit 0.01 ms closing tables 0.01 ms freeing items 0.05 ms cleaning up 0.01 ms # Caller File and line number 17 JDatabaseDriverMysqli->execute() JROOT/libraries/joomla/database/driver.php:1740 16 JDatabaseDriver->loadResult() JROOT/components/com_k2/models/item.php:1468 15 K2ModelItem->countItemComments() JROOT/modules/mod_k2_content/helper.php:442 14 modK2ContentHelper::getItems() JROOT/modules/mod_k2_content/mod_k2_content.php:65 13 include JROOT/modules/mod_k2_content/mod_k2_content.php JROOT/libraries/src/Helper/ModuleHelper.php:200 12 Joomla\CMS\Helper\ModuleHelper::renderModule() Same as call in the line below. 11 call_user_func_array() JROOT/libraries/src/Cache/Controller/CallbackController.php:173 10 Joomla\CMS\Cache\Controller\CallbackController->get() JROOT/libraries/src/Helper/ModuleHelper.php:617 9 Joomla\CMS\Helper\ModuleHelper::moduleCache() JROOT/libraries/src/Document/Renderer/Html/ModuleRenderer.php:95 8 Joomla\CMS\Document\Renderer\Html\ModuleRenderer->render() JROOT/libraries/src/Document/Renderer/Html/ModulesRenderer.php:47 7 Joomla\CMS\Document\Renderer\Html\ModulesRenderer->render() JROOT/libraries/src/Document/HtmlDocument.php:511 6 Joomla\CMS\Document\HtmlDocument->getBuffer() JROOT/libraries/src/Document/HtmlDocument.php:803 5 Joomla\CMS\Document\HtmlDocument->_renderTemplate() JROOT/libraries/src/Document/HtmlDocument.php:577 4 Joomla\CMS\Document\HtmlDocument->render() JROOT/libraries/src/Application/CMSApplication.php:1112 3 Joomla\CMS\Application\CMSApplication->render() JROOT/libraries/src/Application/SiteApplication.php:778 2 Joomla\CMS\Application\SiteApplication->render() JROOT/libraries/src/Application/CMSApplication.php:231 1 Joomla\CMS\Application\CMSApplication->execute() JROOT/index.php:49 - Query Time: 1.79 ms After last query: 1.07 ms Query memory: 0.009 MB Memory before query: 28.042 MB Rows returned: 1
SELECT enabled
FROM w0v41_extensions
WHERE element = 'com_sppagebuilder'
AND type = 'component'id select_type table partitions type possible_keys key key_len ref rows filtered Extra 1 SIMPLE w0v41_extensions NULL ref element_clientid,element_folder_clientid,extension element_clientid 402 const 1 10.00 Using where Status Duration starting 0.08 ms Executing hook on transaction 0.01 ms starting 0.01 ms checking permissions 0.01 ms Opening tables 0.03 ms init 0.01 ms System lock 0.01 ms optimizing 0.01 ms statistics 0.06 ms preparing 0.01 ms executing 0.03 ms end 0.01 ms query end 0.00 ms waiting for handler commit 0.01 ms closing tables 0.01 ms freeing items 0.05 ms cleaning up 0.01 ms # Caller File and line number 20 JDatabaseDriverMysqli->execute() JROOT/libraries/joomla/database/driver.php:1740 19 JDatabaseDriver->loadResult() JROOT/plugins/k2/sppagebuilder/sppagebuilder.php:99 18 plgK2Sppagebuilder->isSppagebuilderEnabled() JROOT/plugins/k2/sppagebuilder/sppagebuilder.php:84 17 plgK2Sppagebuilder->onK2PrepareContent() JROOT/libraries/joomla/event/event.php:70 16 JEvent->update() JROOT/libraries/joomla/event/dispatcher.php:160 15 JEventDispatcher->trigger() JROOT/modules/mod_k2_content/helper.php:518 14 modK2ContentHelper::getItems() JROOT/modules/mod_k2_content/mod_k2_content.php:65 13 include JROOT/modules/mod_k2_content/mod_k2_content.php JROOT/libraries/src/Helper/ModuleHelper.php:200 12 Joomla\CMS\Helper\ModuleHelper::renderModule() Same as call in the line below. 11 call_user_func_array() JROOT/libraries/src/Cache/Controller/CallbackController.php:173 10 Joomla\CMS\Cache\Controller\CallbackController->get() JROOT/libraries/src/Helper/ModuleHelper.php:617 9 Joomla\CMS\Helper\ModuleHelper::moduleCache() JROOT/libraries/src/Document/Renderer/Html/ModuleRenderer.php:95 8 Joomla\CMS\Document\Renderer\Html\ModuleRenderer->render() JROOT/libraries/src/Document/Renderer/Html/ModulesRenderer.php:47 7 Joomla\CMS\Document\Renderer\Html\ModulesRenderer->render() JROOT/libraries/src/Document/HtmlDocument.php:511 6 Joomla\CMS\Document\HtmlDocument->getBuffer() JROOT/libraries/src/Document/HtmlDocument.php:803 5 Joomla\CMS\Document\HtmlDocument->_renderTemplate() JROOT/libraries/src/Document/HtmlDocument.php:577 4 Joomla\CMS\Document\HtmlDocument->render() JROOT/libraries/src/Application/CMSApplication.php:1112 3 Joomla\CMS\Application\CMSApplication->render() JROOT/libraries/src/Application/SiteApplication.php:778 2 Joomla\CMS\Application\SiteApplication->render() JROOT/libraries/src/Application/CMSApplication.php:231 1 Joomla\CMS\Application\CMSApplication->execute() JROOT/index.php:49 - Query Time: 1.67 ms After last query: 0.09 ms Query memory: 0.010 MB Memory before query: 28.054 MB Rows returned: 0Duplicate queries: #99
SELECT *
FROM `w0v41_sppagebuilder`
WHERE `extension` = 'com_k2'
AND `extension_view` = 'itemlist'
AND `view_id` = '99'
AND `active` = 1id select_type table partitions type possible_keys key key_len ref rows filtered Extra 1 SIMPLE w0v41_sppagebuilder NULL ALL NULL NO INDEX KEY COULD BE USED NULL NULL 131 0.76 Using where Status Duration starting 0.09 ms Executing hook on transaction 0.01 ms starting 0.01 ms checking permissions 0.01 ms Opening tables 0.04 ms init 0.01 ms System lock 0.01 ms optimizing 0.01 ms statistics 0.01 ms preparing 0.02 ms executing 1.32 ms end 0.01 ms query end 0.01 ms waiting for handler commit 0.01 ms closing tables 0.01 ms freeing items 0.06 ms cleaning up 0.01 ms # Caller File and line number 21 JDatabaseDriverMysqli->execute() JROOT/libraries/joomla/database/driver.php:1662 20 JDatabaseDriver->loadObject() JROOT/administrator/components/com_sppagebuilder/helpers/sppagebuilder.php:291 19 SppagebuilderHelper::getPageContent() JROOT/administrator/components/com_sppagebuilder/helpers/sppagebuilder.php:248 18 SppagebuilderHelper::onIntegrationPrepareContent() JROOT/plugins/k2/sppagebuilder/sppagebuilder.php:87 17 plgK2Sppagebuilder->onK2PrepareContent() JROOT/libraries/joomla/event/event.php:70 16 JEvent->update() JROOT/libraries/joomla/event/dispatcher.php:160 15 JEventDispatcher->trigger() JROOT/modules/mod_k2_content/helper.php:518 14 modK2ContentHelper::getItems() JROOT/modules/mod_k2_content/mod_k2_content.php:65 13 include JROOT/modules/mod_k2_content/mod_k2_content.php JROOT/libraries/src/Helper/ModuleHelper.php:200 12 Joomla\CMS\Helper\ModuleHelper::renderModule() Same as call in the line below. 11 call_user_func_array() JROOT/libraries/src/Cache/Controller/CallbackController.php:173 10 Joomla\CMS\Cache\Controller\CallbackController->get() JROOT/libraries/src/Helper/ModuleHelper.php:617 9 Joomla\CMS\Helper\ModuleHelper::moduleCache() JROOT/libraries/src/Document/Renderer/Html/ModuleRenderer.php:95 8 Joomla\CMS\Document\Renderer\Html\ModuleRenderer->render() JROOT/libraries/src/Document/Renderer/Html/ModulesRenderer.php:47 7 Joomla\CMS\Document\Renderer\Html\ModulesRenderer->render() JROOT/libraries/src/Document/HtmlDocument.php:511 6 Joomla\CMS\Document\HtmlDocument->getBuffer() JROOT/libraries/src/Document/HtmlDocument.php:803 5 Joomla\CMS\Document\HtmlDocument->_renderTemplate() JROOT/libraries/src/Document/HtmlDocument.php:577 4 Joomla\CMS\Document\HtmlDocument->render() JROOT/libraries/src/Application/CMSApplication.php:1112 3 Joomla\CMS\Application\CMSApplication->render() JROOT/libraries/src/Application/SiteApplication.php:778 2 Joomla\CMS\Application\SiteApplication->render() JROOT/libraries/src/Application/CMSApplication.php:231 1 Joomla\CMS\Application\CMSApplication->execute() JROOT/index.php:49 - Query Time: 1.08 ms After last query: 0.10 ms Query memory: 0.010 MB Memory before query: 28.063 MB Rows returned: 0Duplicate queries: #98
SELECT *
FROM `w0v41_sppagebuilder`
WHERE `extension` = 'com_k2'
AND `extension_view` = 'itemlist'
AND `view_id` = '99'
AND `active` = 1id select_type table partitions type possible_keys key key_len ref rows filtered Extra 1 SIMPLE w0v41_sppagebuilder NULL ALL NULL NO INDEX KEY COULD BE USED NULL NULL 131 0.76 Using where Status Duration starting 0.08 ms Executing hook on transaction 0.01 ms starting 0.01 ms checking permissions 0.01 ms Opening tables 0.03 ms init 0.01 ms System lock 0.01 ms optimizing 0.01 ms statistics 0.01 ms preparing 0.02 ms executing 0.75 ms end 0.01 ms query end 0.00 ms waiting for handler commit 0.01 ms closing tables 0.01 ms freeing items 0.06 ms cleaning up 0.01 ms # Caller File and line number 21 JDatabaseDriverMysqli->execute() JROOT/libraries/joomla/database/driver.php:1662 20 JDatabaseDriver->loadObject() JROOT/administrator/components/com_sppagebuilder/helpers/sppagebuilder.php:291 19 SppagebuilderHelper::getPageContent() JROOT/administrator/components/com_sppagebuilder/helpers/sppagebuilder.php:248 18 SppagebuilderHelper::onIntegrationPrepareContent() JROOT/plugins/k2/sppagebuilder/sppagebuilder.php:89 17 plgK2Sppagebuilder->onK2PrepareContent() JROOT/libraries/joomla/event/event.php:70 16 JEvent->update() JROOT/libraries/joomla/event/dispatcher.php:160 15 JEventDispatcher->trigger() JROOT/modules/mod_k2_content/helper.php:518 14 modK2ContentHelper::getItems() JROOT/modules/mod_k2_content/mod_k2_content.php:65 13 include JROOT/modules/mod_k2_content/mod_k2_content.php JROOT/libraries/src/Helper/ModuleHelper.php:200 12 Joomla\CMS\Helper\ModuleHelper::renderModule() Same as call in the line below. 11 call_user_func_array() JROOT/libraries/src/Cache/Controller/CallbackController.php:173 10 Joomla\CMS\Cache\Controller\CallbackController->get() JROOT/libraries/src/Helper/ModuleHelper.php:617 9 Joomla\CMS\Helper\ModuleHelper::moduleCache() JROOT/libraries/src/Document/Renderer/Html/ModuleRenderer.php:95 8 Joomla\CMS\Document\Renderer\Html\ModuleRenderer->render() JROOT/libraries/src/Document/Renderer/Html/ModulesRenderer.php:47 7 Joomla\CMS\Document\Renderer\Html\ModulesRenderer->render() JROOT/libraries/src/Document/HtmlDocument.php:511 6 Joomla\CMS\Document\HtmlDocument->getBuffer() JROOT/libraries/src/Document/HtmlDocument.php:803 5 Joomla\CMS\Document\HtmlDocument->_renderTemplate() JROOT/libraries/src/Document/HtmlDocument.php:577 4 Joomla\CMS\Document\HtmlDocument->render() JROOT/libraries/src/Application/CMSApplication.php:1112 3 Joomla\CMS\Application\CMSApplication->render() JROOT/libraries/src/Application/SiteApplication.php:778 2 Joomla\CMS\Application\SiteApplication->render() JROOT/libraries/src/Application/CMSApplication.php:231 1 Joomla\CMS\Application\CMSApplication->execute() JROOT/index.php:49 - Query Time: 1.11 ms After last query: 0.15 ms Query memory: 0.010 MB Memory before query: 28.074 MB Rows returned: 1
SELECT *
FROM `w0v41_users`
WHERE `id` = 112id select_type table partitions type possible_keys key key_len ref rows filtered Extra 1 SIMPLE w0v41_users NULL const PRIMARY PRIMARY 4 const 1 100.00 NULL Status Duration starting 0.08 ms Executing hook on transaction 0.01 ms starting 0.01 ms checking permissions 0.01 ms Opening tables 0.03 ms init 0.01 ms System lock 0.01 ms optimizing 0.01 ms statistics 0.06 ms preparing 0.01 ms executing 0.02 ms end 0.01 ms query end 0.00 ms waiting for handler commit 0.01 ms closing tables 0.01 ms freeing items 0.05 ms cleaning up 0.01 ms # Caller File and line number 21 JDatabaseDriverMysqli->execute() JROOT/libraries/joomla/database/driver.php:1465 20 JDatabaseDriver->loadAssoc() JROOT/libraries/src/Table/User.php:87 19 Joomla\CMS\Table\User->load() JROOT/libraries/src/User/User.php:880 18 Joomla\CMS\User\User->load() JROOT/libraries/src/User/User.php:248 17 Joomla\CMS\User\User->__construct() JROOT/libraries/src/User/User.php:301 16 Joomla\CMS\User\User::getInstance() JROOT/libraries/src/Factory.php:266 15 Joomla\CMS\Factory::getUser() JROOT/modules/mod_k2_content/helper.php:544 14 modK2ContentHelper::getItems() JROOT/modules/mod_k2_content/mod_k2_content.php:65 13 include JROOT/modules/mod_k2_content/mod_k2_content.php JROOT/libraries/src/Helper/ModuleHelper.php:200 12 Joomla\CMS\Helper\ModuleHelper::renderModule() Same as call in the line below. 11 call_user_func_array() JROOT/libraries/src/Cache/Controller/CallbackController.php:173 10 Joomla\CMS\Cache\Controller\CallbackController->get() JROOT/libraries/src/Helper/ModuleHelper.php:617 9 Joomla\CMS\Helper\ModuleHelper::moduleCache() JROOT/libraries/src/Document/Renderer/Html/ModuleRenderer.php:95 8 Joomla\CMS\Document\Renderer\Html\ModuleRenderer->render() JROOT/libraries/src/Document/Renderer/Html/ModulesRenderer.php:47 7 Joomla\CMS\Document\Renderer\Html\ModulesRenderer->render() JROOT/libraries/src/Document/HtmlDocument.php:511 6 Joomla\CMS\Document\HtmlDocument->getBuffer() JROOT/libraries/src/Document/HtmlDocument.php:803 5 Joomla\CMS\Document\HtmlDocument->_renderTemplate() JROOT/libraries/src/Document/HtmlDocument.php:577 4 Joomla\CMS\Document\HtmlDocument->render() JROOT/libraries/src/Application/CMSApplication.php:1112 3 Joomla\CMS\Application\CMSApplication->render() JROOT/libraries/src/Application/SiteApplication.php:778 2 Joomla\CMS\Application\SiteApplication->render() JROOT/libraries/src/Application/CMSApplication.php:231 1 Joomla\CMS\Application\CMSApplication->execute() JROOT/index.php:49 - Query Time: 0.38 ms After last query: 0.12 ms Query memory: 0.010 MB Memory before query: 28.087 MB Rows returned: 3
SELECT `g`.`id`,`g`.`title`
FROM `w0v41_usergroups` AS g
INNER JOIN `w0v41_user_usergroup_map` AS m
ON m.group_id = g.id
WHERE `m`.`user_id` = 112id select_type table partitions type possible_keys key key_len ref rows filtered Extra 1 SIMPLE m NULL ref PRIMARY PRIMARY 4 const 3 100.00 Using index 1 SIMPLE g NULL eq_ref PRIMARY PRIMARY 4 h88876_SDAT.m.group_id 1 100.00 NULL Status Duration starting 0.09 ms Executing hook on transaction 0.01 ms starting 0.01 ms checking permissions 0.00 ms checking permissions 0.01 ms Opening tables 0.03 ms init 0.01 ms System lock 0.01 ms optimizing 0.01 ms statistics 0.06 ms preparing 0.02 ms executing 0.04 ms end 0.00 ms query end 0.00 ms waiting for handler commit 0.01 ms closing tables 0.01 ms freeing items 0.05 ms cleaning up 0.01 ms # Caller File and line number 21 JDatabaseDriverMysqli->execute() JROOT/libraries/joomla/database/driver.php:1506 20 JDatabaseDriver->loadAssocList() JROOT/libraries/src/Table/User.php:112 19 Joomla\CMS\Table\User->load() JROOT/libraries/src/User/User.php:880 18 Joomla\CMS\User\User->load() JROOT/libraries/src/User/User.php:248 17 Joomla\CMS\User\User->__construct() JROOT/libraries/src/User/User.php:301 16 Joomla\CMS\User\User::getInstance() JROOT/libraries/src/Factory.php:266 15 Joomla\CMS\Factory::getUser() JROOT/modules/mod_k2_content/helper.php:544 14 modK2ContentHelper::getItems() JROOT/modules/mod_k2_content/mod_k2_content.php:65 13 include JROOT/modules/mod_k2_content/mod_k2_content.php JROOT/libraries/src/Helper/ModuleHelper.php:200 12 Joomla\CMS\Helper\ModuleHelper::renderModule() Same as call in the line below. 11 call_user_func_array() JROOT/libraries/src/Cache/Controller/CallbackController.php:173 10 Joomla\CMS\Cache\Controller\CallbackController->get() JROOT/libraries/src/Helper/ModuleHelper.php:617 9 Joomla\CMS\Helper\ModuleHelper::moduleCache() JROOT/libraries/src/Document/Renderer/Html/ModuleRenderer.php:95 8 Joomla\CMS\Document\Renderer\Html\ModuleRenderer->render() JROOT/libraries/src/Document/Renderer/Html/ModulesRenderer.php:47 7 Joomla\CMS\Document\Renderer\Html\ModulesRenderer->render() JROOT/libraries/src/Document/HtmlDocument.php:511 6 Joomla\CMS\Document\HtmlDocument->getBuffer() JROOT/libraries/src/Document/HtmlDocument.php:803 5 Joomla\CMS\Document\HtmlDocument->_renderTemplate() JROOT/libraries/src/Document/HtmlDocument.php:577 4 Joomla\CMS\Document\HtmlDocument->render() JROOT/libraries/src/Application/CMSApplication.php:1112 3 Joomla\CMS\Application\CMSApplication->render() JROOT/libraries/src/Application/SiteApplication.php:778 2 Joomla\CMS\Application\SiteApplication->render() JROOT/libraries/src/Application/CMSApplication.php:231 1 Joomla\CMS\Application\CMSApplication->execute() JROOT/index.php:49 - Query Time: 0.27 ms After last query: 0.08 ms Query memory: 0.007 MB Memory before query: 28.092 MB Rows returned: 1
SELECT `description`, `gender`
FROM w0v41_k2_users
WHERE userID=112
LIMIT 0, 1id select_type table partitions type possible_keys key key_len ref rows filtered Extra 1 SIMPLE w0v41_k2_users NULL ref userID userID 4 const 1 100.00 NULL Status Duration starting 0.06 ms Executing hook on transaction 0.00 ms starting 0.01 ms checking permissions 0.00 ms Opening tables 0.02 ms init 0.01 ms System lock 0.01 ms optimizing 0.01 ms statistics 0.03 ms preparing 0.01 ms executing 0.02 ms end 0.01 ms query end 0.00 ms waiting for handler commit 0.01 ms closing tables 0.01 ms freeing items 0.05 ms cleaning up 0.01 ms # Caller File and line number 16 JDatabaseDriverMysqli->execute() JROOT/libraries/joomla/database/driver.php:1662 15 JDatabaseDriver->loadObject() JROOT/modules/mod_k2_content/helper.php:550 14 modK2ContentHelper::getItems() JROOT/modules/mod_k2_content/mod_k2_content.php:65 13 include JROOT/modules/mod_k2_content/mod_k2_content.php JROOT/libraries/src/Helper/ModuleHelper.php:200 12 Joomla\CMS\Helper\ModuleHelper::renderModule() Same as call in the line below. 11 call_user_func_array() JROOT/libraries/src/Cache/Controller/CallbackController.php:173 10 Joomla\CMS\Cache\Controller\CallbackController->get() JROOT/libraries/src/Helper/ModuleHelper.php:617 9 Joomla\CMS\Helper\ModuleHelper::moduleCache() JROOT/libraries/src/Document/Renderer/Html/ModuleRenderer.php:95 8 Joomla\CMS\Document\Renderer\Html\ModuleRenderer->render() JROOT/libraries/src/Document/Renderer/Html/ModulesRenderer.php:47 7 Joomla\CMS\Document\Renderer\Html\ModulesRenderer->render() JROOT/libraries/src/Document/HtmlDocument.php:511 6 Joomla\CMS\Document\HtmlDocument->getBuffer() JROOT/libraries/src/Document/HtmlDocument.php:803 5 Joomla\CMS\Document\HtmlDocument->_renderTemplate() JROOT/libraries/src/Document/HtmlDocument.php:577 4 Joomla\CMS\Document\HtmlDocument->render() JROOT/libraries/src/Application/CMSApplication.php:1112 3 Joomla\CMS\Application\CMSApplication->render() JROOT/libraries/src/Application/SiteApplication.php:778 2 Joomla\CMS\Application\SiteApplication->render() JROOT/libraries/src/Application/CMSApplication.php:231 1 Joomla\CMS\Application\CMSApplication->execute() JROOT/index.php:49 - Query Time: 0.30 ms After last query: 0.43 ms Query memory: 0.009 MB Memory before query: 28.100 MB Rows returned: 1
SELECT id, gender, description, image, url, `
group`, plugins
FROM w0v41_k2_users
WHERE userID=112id select_type table partitions type possible_keys key key_len ref rows filtered Extra 1 SIMPLE w0v41_k2_users NULL ref userID userID 4 const 1 100.00 NULL Status Duration starting 0.08 ms Executing hook on transaction 0.01 ms starting 0.01 ms checking permissions 0.01 ms Opening tables 0.02 ms init 0.01 ms System lock 0.01 ms optimizing 0.01 ms statistics 0.03 ms preparing 0.01 ms executing 0.03 ms end 0.01 ms query end 0.00 ms waiting for handler commit 0.01 ms closing tables 0.01 ms freeing items 0.05 ms cleaning up 0.01 ms # Caller File and line number 18 JDatabaseDriverMysqli->execute() JROOT/libraries/joomla/database/driver.php:1662 17 JDatabaseDriver->loadObject() JROOT/components/com_k2/models/item.php:1681 16 K2ModelItem->getUserProfile() JROOT/components/com_k2/helpers/utilities.php:45 15 K2HelperUtilities::getAvatar() JROOT/modules/mod_k2_content/helper.php:560 14 modK2ContentHelper::getItems() JROOT/modules/mod_k2_content/mod_k2_content.php:65 13 include JROOT/modules/mod_k2_content/mod_k2_content.php JROOT/libraries/src/Helper/ModuleHelper.php:200 12 Joomla\CMS\Helper\ModuleHelper::renderModule() Same as call in the line below. 11 call_user_func_array() JROOT/libraries/src/Cache/Controller/CallbackController.php:173 10 Joomla\CMS\Cache\Controller\CallbackController->get() JROOT/libraries/src/Helper/ModuleHelper.php:617 9 Joomla\CMS\Helper\ModuleHelper::moduleCache() JROOT/libraries/src/Document/Renderer/Html/ModuleRenderer.php:95 8 Joomla\CMS\Document\Renderer\Html\ModuleRenderer->render() JROOT/libraries/src/Document/Renderer/Html/ModulesRenderer.php:47 7 Joomla\CMS\Document\Renderer\Html\ModulesRenderer->render() JROOT/libraries/src/Document/HtmlDocument.php:511 6 Joomla\CMS\Document\HtmlDocument->getBuffer() JROOT/libraries/src/Document/HtmlDocument.php:803 5 Joomla\CMS\Document\HtmlDocument->_renderTemplate() JROOT/libraries/src/Document/HtmlDocument.php:577 4 Joomla\CMS\Document\HtmlDocument->render() JROOT/libraries/src/Application/CMSApplication.php:1112 3 Joomla\CMS\Application\CMSApplication->render() JROOT/libraries/src/Application/SiteApplication.php:778 2 Joomla\CMS\Application\SiteApplication->render() JROOT/libraries/src/Application/CMSApplication.php:231 1 Joomla\CMS\Application\CMSApplication->execute() JROOT/index.php:49 - Query Time: 0.40 ms After last query: 0.80 ms Query memory: 0.008 MB Memory before query: 28.111 MB Rows returned: 4
SELECT tag.*
FROM w0v41_k2_tags AS tag JOIN w0v41_k2_tags_xref AS xref
ON tag.id = xref.tagID
WHERE tag.published = 1
AND xref.itemID = 97
ORDER BY xref.id ASCid select_type table partitions type possible_keys key key_len ref rows filtered Extra 1 SIMPLE xref NULL ref tagID,itemID itemID 4 const 4 100.00 NULL 1 SIMPLE tag NULL eq_ref PRIMARY,published PRIMARY 4 h88876_SDAT.xref.tagID 1 100.00 Using where Status Duration starting 0.09 ms Executing hook on transaction 0.01 ms starting 0.01 ms checking permissions 0.00 ms checking permissions 0.00 ms Opening tables 0.03 ms init 0.01 ms System lock 0.01 ms optimizing 0.01 ms statistics 0.05 ms preparing 0.02 ms executing 0.06 ms end 0.01 ms query end 0.01 ms waiting for handler commit 0.01 ms closing tables 0.01 ms freeing items 0.05 ms cleaning up 0.01 ms # Caller File and line number 17 JDatabaseDriverMysqli->execute() JROOT/libraries/joomla/database/driver.php:1701 16 JDatabaseDriver->loadObjectList() JROOT/components/com_k2/models/item.php:1201 15 K2ModelItem->getItemTags() JROOT/modules/mod_k2_content/helper.php:303 14 modK2ContentHelper::getItems() JROOT/modules/mod_k2_content/mod_k2_content.php:65 13 include JROOT/modules/mod_k2_content/mod_k2_content.php JROOT/libraries/src/Helper/ModuleHelper.php:200 12 Joomla\CMS\Helper\ModuleHelper::renderModule() Same as call in the line below. 11 call_user_func_array() JROOT/libraries/src/Cache/Controller/CallbackController.php:173 10 Joomla\CMS\Cache\Controller\CallbackController->get() JROOT/libraries/src/Helper/ModuleHelper.php:617 9 Joomla\CMS\Helper\ModuleHelper::moduleCache() JROOT/libraries/src/Document/Renderer/Html/ModuleRenderer.php:95 8 Joomla\CMS\Document\Renderer\Html\ModuleRenderer->render() JROOT/libraries/src/Document/Renderer/Html/ModulesRenderer.php:47 7 Joomla\CMS\Document\Renderer\Html\ModulesRenderer->render() JROOT/libraries/src/Document/HtmlDocument.php:511 6 Joomla\CMS\Document\HtmlDocument->getBuffer() JROOT/libraries/src/Document/HtmlDocument.php:803 5 Joomla\CMS\Document\HtmlDocument->_renderTemplate() JROOT/libraries/src/Document/HtmlDocument.php:577 4 Joomla\CMS\Document\HtmlDocument->render() JROOT/libraries/src/Application/CMSApplication.php:1112 3 Joomla\CMS\Application\CMSApplication->render() JROOT/libraries/src/Application/SiteApplication.php:778 2 Joomla\CMS\Application\SiteApplication->render() JROOT/libraries/src/Application/CMSApplication.php:231 1 Joomla\CMS\Application\CMSApplication->execute() JROOT/index.php:49 - Query Time: 0.31 ms After last query: 1.11 ms Query memory: 0.008 MB Memory before query: 28.128 MB Rows returned: 0
SELECT *
FROM w0v41_k2_attachments
WHERE itemID=97id select_type table partitions type possible_keys key key_len ref rows filtered Extra 1 SIMPLE w0v41_k2_attachments NULL ref itemID itemID 4 const 1 100.00 NULL Status Duration starting 0.09 ms Executing hook on transaction 0.01 ms starting 0.01 ms checking permissions 0.00 ms Opening tables 0.02 ms init 0.01 ms System lock 0.01 ms optimizing 0.01 ms statistics 0.03 ms preparing 0.01 ms executing 0.02 ms end 0.01 ms query end 0.00 ms waiting for handler commit 0.01 ms closing tables 0.01 ms freeing items 0.05 ms cleaning up 0.01 ms # Caller File and line number 17 JDatabaseDriverMysqli->execute() JROOT/libraries/joomla/database/driver.php:1701 16 JDatabaseDriver->loadObjectList() JROOT/components/com_k2/models/item.php:1429 15 K2ModelItem->getItemAttachments() JROOT/modules/mod_k2_content/helper.php:437 14 modK2ContentHelper::getItems() JROOT/modules/mod_k2_content/mod_k2_content.php:65 13 include JROOT/modules/mod_k2_content/mod_k2_content.php JROOT/libraries/src/Helper/ModuleHelper.php:200 12 Joomla\CMS\Helper\ModuleHelper::renderModule() Same as call in the line below. 11 call_user_func_array() JROOT/libraries/src/Cache/Controller/CallbackController.php:173 10 Joomla\CMS\Cache\Controller\CallbackController->get() JROOT/libraries/src/Helper/ModuleHelper.php:617 9 Joomla\CMS\Helper\ModuleHelper::moduleCache() JROOT/libraries/src/Document/Renderer/Html/ModuleRenderer.php:95 8 Joomla\CMS\Document\Renderer\Html\ModuleRenderer->render() JROOT/libraries/src/Document/Renderer/Html/ModulesRenderer.php:47 7 Joomla\CMS\Document\Renderer\Html\ModulesRenderer->render() JROOT/libraries/src/Document/HtmlDocument.php:511 6 Joomla\CMS\Document\HtmlDocument->getBuffer() JROOT/libraries/src/Document/HtmlDocument.php:803 5 Joomla\CMS\Document\HtmlDocument->_renderTemplate() JROOT/libraries/src/Document/HtmlDocument.php:577 4 Joomla\CMS\Document\HtmlDocument->render() JROOT/libraries/src/Application/CMSApplication.php:1112 3 Joomla\CMS\Application\CMSApplication->render() JROOT/libraries/src/Application/SiteApplication.php:778 2 Joomla\CMS\Application\SiteApplication->render() JROOT/libraries/src/Application/CMSApplication.php:231 1 Joomla\CMS\Application\CMSApplication->execute() JROOT/index.php:49 - Query Time: 0.31 ms After last query: 0.04 ms Query memory: 0.008 MB Memory before query: 28.136 MB Rows returned: 1
SELECT COUNT(*)
FROM w0v41_k2_comments
WHERE itemID=97
AND published=1id select_type table partitions type possible_keys key key_len ref rows filtered Extra 1 SIMPLE w0v41_k2_comments NULL ref itemID,published,latestComments,countComments countComments 8 const,const 1 100.00 Using index Status Duration starting 0.07 ms Executing hook on transaction 0.01 ms starting 0.01 ms checking permissions 0.01 ms Opening tables 0.02 ms init 0.01 ms System lock 0.01 ms optimizing 0.01 ms statistics 0.05 ms preparing 0.02 ms executing 0.02 ms end 0.00 ms query end 0.00 ms waiting for handler commit 0.01 ms closing tables 0.01 ms freeing items 0.05 ms cleaning up 0.01 ms # Caller File and line number 17 JDatabaseDriverMysqli->execute() JROOT/libraries/joomla/database/driver.php:1740 16 JDatabaseDriver->loadResult() JROOT/components/com_k2/models/item.php:1468 15 K2ModelItem->countItemComments() JROOT/modules/mod_k2_content/helper.php:442 14 modK2ContentHelper::getItems() JROOT/modules/mod_k2_content/mod_k2_content.php:65 13 include JROOT/modules/mod_k2_content/mod_k2_content.php JROOT/libraries/src/Helper/ModuleHelper.php:200 12 Joomla\CMS\Helper\ModuleHelper::renderModule() Same as call in the line below. 11 call_user_func_array() JROOT/libraries/src/Cache/Controller/CallbackController.php:173 10 Joomla\CMS\Cache\Controller\CallbackController->get() JROOT/libraries/src/Helper/ModuleHelper.php:617 9 Joomla\CMS\Helper\ModuleHelper::moduleCache() JROOT/libraries/src/Document/Renderer/Html/ModuleRenderer.php:95 8 Joomla\CMS\Document\Renderer\Html\ModuleRenderer->render() JROOT/libraries/src/Document/Renderer/Html/ModulesRenderer.php:47 7 Joomla\CMS\Document\Renderer\Html\ModulesRenderer->render() JROOT/libraries/src/Document/HtmlDocument.php:511 6 Joomla\CMS\Document\HtmlDocument->getBuffer() JROOT/libraries/src/Document/HtmlDocument.php:803 5 Joomla\CMS\Document\HtmlDocument->_renderTemplate() JROOT/libraries/src/Document/HtmlDocument.php:577 4 Joomla\CMS\Document\HtmlDocument->render() JROOT/libraries/src/Application/CMSApplication.php:1112 3 Joomla\CMS\Application\CMSApplication->render() JROOT/libraries/src/Application/SiteApplication.php:778 2 Joomla\CMS\Application\SiteApplication->render() JROOT/libraries/src/Application/CMSApplication.php:231 1 Joomla\CMS\Application\CMSApplication->execute() JROOT/index.php:49 - Query Time: 0.36 ms After last query: 1.24 ms Query memory: 0.009 MB Memory before query: 28.148 MB Rows returned: 1
SELECT enabled
FROM w0v41_extensions
WHERE element = 'com_sppagebuilder'
AND type = 'component'id select_type table partitions type possible_keys key key_len ref rows filtered Extra 1 SIMPLE w0v41_extensions NULL ref element_clientid,element_folder_clientid,extension element_clientid 402 const 1 10.00 Using where Status Duration starting 0.08 ms Executing hook on transaction 0.01 ms starting 0.01 ms checking permissions 0.01 ms Opening tables 0.02 ms init 0.01 ms System lock 0.01 ms optimizing 0.02 ms statistics 0.07 ms preparing 0.02 ms executing 0.03 ms end 0.01 ms query end 0.00 ms waiting for handler commit 0.01 ms closing tables 0.01 ms freeing items 0.05 ms cleaning up 0.01 ms # Caller File and line number 20 JDatabaseDriverMysqli->execute() JROOT/libraries/joomla/database/driver.php:1740 19 JDatabaseDriver->loadResult() JROOT/plugins/k2/sppagebuilder/sppagebuilder.php:99 18 plgK2Sppagebuilder->isSppagebuilderEnabled() JROOT/plugins/k2/sppagebuilder/sppagebuilder.php:84 17 plgK2Sppagebuilder->onK2PrepareContent() JROOT/libraries/joomla/event/event.php:70 16 JEvent->update() JROOT/libraries/joomla/event/dispatcher.php:160 15 JEventDispatcher->trigger() JROOT/modules/mod_k2_content/helper.php:518 14 modK2ContentHelper::getItems() JROOT/modules/mod_k2_content/mod_k2_content.php:65 13 include JROOT/modules/mod_k2_content/mod_k2_content.php JROOT/libraries/src/Helper/ModuleHelper.php:200 12 Joomla\CMS\Helper\ModuleHelper::renderModule() Same as call in the line below. 11 call_user_func_array() JROOT/libraries/src/Cache/Controller/CallbackController.php:173 10 Joomla\CMS\Cache\Controller\CallbackController->get() JROOT/libraries/src/Helper/ModuleHelper.php:617 9 Joomla\CMS\Helper\ModuleHelper::moduleCache() JROOT/libraries/src/Document/Renderer/Html/ModuleRenderer.php:95 8 Joomla\CMS\Document\Renderer\Html\ModuleRenderer->render() JROOT/libraries/src/Document/Renderer/Html/ModulesRenderer.php:47 7 Joomla\CMS\Document\Renderer\Html\ModulesRenderer->render() JROOT/libraries/src/Document/HtmlDocument.php:511 6 Joomla\CMS\Document\HtmlDocument->getBuffer() JROOT/libraries/src/Document/HtmlDocument.php:803 5 Joomla\CMS\Document\HtmlDocument->_renderTemplate() JROOT/libraries/src/Document/HtmlDocument.php:577 4 Joomla\CMS\Document\HtmlDocument->render() JROOT/libraries/src/Application/CMSApplication.php:1112 3 Joomla\CMS\Application\CMSApplication->render() JROOT/libraries/src/Application/SiteApplication.php:778 2 Joomla\CMS\Application\SiteApplication->render() JROOT/libraries/src/Application/CMSApplication.php:231 1 Joomla\CMS\Application\CMSApplication->execute() JROOT/index.php:49 - Query Time: 1.66 ms After last query: 0.07 ms Query memory: 0.010 MB Memory before query: 28.160 MB Rows returned: 0Duplicate queries: #109
SELECT *
FROM `w0v41_sppagebuilder`
WHERE `extension` = 'com_k2'
AND `extension_view` = 'itemlist'
AND `view_id` = '97'
AND `active` = 1id select_type table partitions type possible_keys key key_len ref rows filtered Extra 1 SIMPLE w0v41_sppagebuilder NULL ALL NULL NO INDEX KEY COULD BE USED NULL NULL 131 0.76 Using where Status Duration starting 0.07 ms Executing hook on transaction 0.01 ms starting 0.01 ms checking permissions 0.01 ms Opening tables 0.03 ms init 0.01 ms System lock 0.01 ms optimizing 0.01 ms statistics 0.01 ms preparing 0.01 ms executing 1.02 ms end 0.01 ms query end 0.01 ms waiting for handler commit 0.01 ms closing tables 0.01 ms freeing items 0.07 ms cleaning up 0.01 ms # Caller File and line number 21 JDatabaseDriverMysqli->execute() JROOT/libraries/joomla/database/driver.php:1662 20 JDatabaseDriver->loadObject() JROOT/administrator/components/com_sppagebuilder/helpers/sppagebuilder.php:291 19 SppagebuilderHelper::getPageContent() JROOT/administrator/components/com_sppagebuilder/helpers/sppagebuilder.php:248 18 SppagebuilderHelper::onIntegrationPrepareContent() JROOT/plugins/k2/sppagebuilder/sppagebuilder.php:87 17 plgK2Sppagebuilder->onK2PrepareContent() JROOT/libraries/joomla/event/event.php:70 16 JEvent->update() JROOT/libraries/joomla/event/dispatcher.php:160 15 JEventDispatcher->trigger() JROOT/modules/mod_k2_content/helper.php:518 14 modK2ContentHelper::getItems() JROOT/modules/mod_k2_content/mod_k2_content.php:65 13 include JROOT/modules/mod_k2_content/mod_k2_content.php JROOT/libraries/src/Helper/ModuleHelper.php:200 12 Joomla\CMS\Helper\ModuleHelper::renderModule() Same as call in the line below. 11 call_user_func_array() JROOT/libraries/src/Cache/Controller/CallbackController.php:173 10 Joomla\CMS\Cache\Controller\CallbackController->get() JROOT/libraries/src/Helper/ModuleHelper.php:617 9 Joomla\CMS\Helper\ModuleHelper::moduleCache() JROOT/libraries/src/Document/Renderer/Html/ModuleRenderer.php:95 8 Joomla\CMS\Document\Renderer\Html\ModuleRenderer->render() JROOT/libraries/src/Document/Renderer/Html/ModulesRenderer.php:47 7 Joomla\CMS\Document\Renderer\Html\ModulesRenderer->render() JROOT/libraries/src/Document/HtmlDocument.php:511 6 Joomla\CMS\Document\HtmlDocument->getBuffer() JROOT/libraries/src/Document/HtmlDocument.php:803 5 Joomla\CMS\Document\HtmlDocument->_renderTemplate() JROOT/libraries/src/Document/HtmlDocument.php:577 4 Joomla\CMS\Document\HtmlDocument->render() JROOT/libraries/src/Application/CMSApplication.php:1112 3 Joomla\CMS\Application\CMSApplication->render() JROOT/libraries/src/Application/SiteApplication.php:778 2 Joomla\CMS\Application\SiteApplication->render() JROOT/libraries/src/Application/CMSApplication.php:231 1 Joomla\CMS\Application\CMSApplication->execute() JROOT/index.php:49 - Query Time: 1.22 ms After last query: 0.11 ms Query memory: 0.010 MB Memory before query: 28.169 MB Rows returned: 0Duplicate queries: #108
SELECT *
FROM `w0v41_sppagebuilder`
WHERE `extension` = 'com_k2'
AND `extension_view` = 'itemlist'
AND `view_id` = '97'
AND `active` = 1id select_type table partitions type possible_keys key key_len ref rows filtered Extra 1 SIMPLE w0v41_sppagebuilder NULL ALL NULL NO INDEX KEY COULD BE USED NULL NULL 131 0.76 Using where Status Duration starting 0.09 ms Executing hook on transaction 0.01 ms starting 0.01 ms checking permissions 0.01 ms Opening tables 0.03 ms init 0.01 ms System lock 0.01 ms optimizing 0.01 ms statistics 0.01 ms preparing 0.02 ms executing 0.87 ms end 0.01 ms query end 0.00 ms waiting for handler commit 0.01 ms closing tables 0.01 ms freeing items 0.06 ms cleaning up 0.01 ms # Caller File and line number 21 JDatabaseDriverMysqli->execute() JROOT/libraries/joomla/database/driver.php:1662 20 JDatabaseDriver->loadObject() JROOT/administrator/components/com_sppagebuilder/helpers/sppagebuilder.php:291 19 SppagebuilderHelper::getPageContent() JROOT/administrator/components/com_sppagebuilder/helpers/sppagebuilder.php:248 18 SppagebuilderHelper::onIntegrationPrepareContent() JROOT/plugins/k2/sppagebuilder/sppagebuilder.php:89 17 plgK2Sppagebuilder->onK2PrepareContent() JROOT/libraries/joomla/event/event.php:70 16 JEvent->update() JROOT/libraries/joomla/event/dispatcher.php:160 15 JEventDispatcher->trigger() JROOT/modules/mod_k2_content/helper.php:518 14 modK2ContentHelper::getItems() JROOT/modules/mod_k2_content/mod_k2_content.php:65 13 include JROOT/modules/mod_k2_content/mod_k2_content.php JROOT/libraries/src/Helper/ModuleHelper.php:200 12 Joomla\CMS\Helper\ModuleHelper::renderModule() Same as call in the line below. 11 call_user_func_array() JROOT/libraries/src/Cache/Controller/CallbackController.php:173 10 Joomla\CMS\Cache\Controller\CallbackController->get() JROOT/libraries/src/Helper/ModuleHelper.php:617 9 Joomla\CMS\Helper\ModuleHelper::moduleCache() JROOT/libraries/src/Document/Renderer/Html/ModuleRenderer.php:95 8 Joomla\CMS\Document\Renderer\Html\ModuleRenderer->render() JROOT/libraries/src/Document/Renderer/Html/ModulesRenderer.php:47 7 Joomla\CMS\Document\Renderer\Html\ModulesRenderer->render() JROOT/libraries/src/Document/HtmlDocument.php:511 6 Joomla\CMS\Document\HtmlDocument->getBuffer() JROOT/libraries/src/Document/HtmlDocument.php:803 5 Joomla\CMS\Document\HtmlDocument->_renderTemplate() JROOT/libraries/src/Document/HtmlDocument.php:577 4 Joomla\CMS\Document\HtmlDocument->render() JROOT/libraries/src/Application/CMSApplication.php:1112 3 Joomla\CMS\Application\CMSApplication->render() JROOT/libraries/src/Application/SiteApplication.php:778 2 Joomla\CMS\Application\SiteApplication->render() JROOT/libraries/src/Application/CMSApplication.php:231 1 Joomla\CMS\Application\CMSApplication->execute() JROOT/index.php:49 - Query Time: 0.31 ms After last query: 0.08 ms Query memory: 0.007 MB Memory before query: 28.174 MB Rows returned: 1
SELECT `description`, `gender`
FROM w0v41_k2_users
WHERE userID=112
LIMIT 0, 1id select_type table partitions type possible_keys key key_len ref rows filtered Extra 1 SIMPLE w0v41_k2_users NULL ref userID userID 4 const 1 100.00 NULL Status Duration starting 0.07 ms Executing hook on transaction 0.01 ms starting 0.01 ms checking permissions 0.00 ms Opening tables 0.02 ms init 0.01 ms System lock 0.01 ms optimizing 0.01 ms statistics 0.04 ms preparing 0.01 ms executing 0.03 ms end 0.00 ms query end 0.00 ms waiting for handler commit 0.01 ms closing tables 0.01 ms freeing items 0.05 ms cleaning up 0.01 ms # Caller File and line number 16 JDatabaseDriverMysqli->execute() JROOT/libraries/joomla/database/driver.php:1662 15 JDatabaseDriver->loadObject() JROOT/modules/mod_k2_content/helper.php:550 14 modK2ContentHelper::getItems() JROOT/modules/mod_k2_content/mod_k2_content.php:65 13 include JROOT/modules/mod_k2_content/mod_k2_content.php JROOT/libraries/src/Helper/ModuleHelper.php:200 12 Joomla\CMS\Helper\ModuleHelper::renderModule() Same as call in the line below. 11 call_user_func_array() JROOT/libraries/src/Cache/Controller/CallbackController.php:173 10 Joomla\CMS\Cache\Controller\CallbackController->get() JROOT/libraries/src/Helper/ModuleHelper.php:617 9 Joomla\CMS\Helper\ModuleHelper::moduleCache() JROOT/libraries/src/Document/Renderer/Html/ModuleRenderer.php:95 8 Joomla\CMS\Document\Renderer\Html\ModuleRenderer->render() JROOT/libraries/src/Document/Renderer/Html/ModulesRenderer.php:47 7 Joomla\CMS\Document\Renderer\Html\ModulesRenderer->render() JROOT/libraries/src/Document/HtmlDocument.php:511 6 Joomla\CMS\Document\HtmlDocument->getBuffer() JROOT/libraries/src/Document/HtmlDocument.php:803 5 Joomla\CMS\Document\HtmlDocument->_renderTemplate() JROOT/libraries/src/Document/HtmlDocument.php:577 4 Joomla\CMS\Document\HtmlDocument->render() JROOT/libraries/src/Application/CMSApplication.php:1112 3 Joomla\CMS\Application\CMSApplication->render() JROOT/libraries/src/Application/SiteApplication.php:778 2 Joomla\CMS\Application\SiteApplication->render() JROOT/libraries/src/Application/CMSApplication.php:231 1 Joomla\CMS\Application\CMSApplication->execute() JROOT/index.php:49 - Query Time: 0.43 ms After last query: 0.96 ms Query memory: 0.008 MB Memory before query: 28.182 MB Rows returned: 5
SELECT tag.*
FROM w0v41_k2_tags AS tag JOIN w0v41_k2_tags_xref AS xref
ON tag.id = xref.tagID
WHERE tag.published = 1
AND xref.itemID = 95
ORDER BY xref.id ASCid select_type table partitions type possible_keys key key_len ref rows filtered Extra 1 SIMPLE xref NULL ref tagID,itemID itemID 4 const 5 100.00 NULL 1 SIMPLE tag NULL eq_ref PRIMARY,published PRIMARY 4 h88876_SDAT.xref.tagID 1 100.00 Using where Status Duration starting 0.09 ms Executing hook on transaction 0.01 ms starting 0.01 ms checking permissions 0.01 ms checking permissions 0.01 ms Opening tables 0.03 ms init 0.01 ms System lock 0.01 ms optimizing 0.01 ms statistics 0.05 ms preparing 0.02 ms executing 0.07 ms end 0.01 ms query end 0.00 ms waiting for handler commit 0.01 ms closing tables 0.01 ms freeing items 0.06 ms cleaning up 0.01 ms # Caller File and line number 17 JDatabaseDriverMysqli->execute() JROOT/libraries/joomla/database/driver.php:1701 16 JDatabaseDriver->loadObjectList() JROOT/components/com_k2/models/item.php:1201 15 K2ModelItem->getItemTags() JROOT/modules/mod_k2_content/helper.php:303 14 modK2ContentHelper::getItems() JROOT/modules/mod_k2_content/mod_k2_content.php:65 13 include JROOT/modules/mod_k2_content/mod_k2_content.php JROOT/libraries/src/Helper/ModuleHelper.php:200 12 Joomla\CMS\Helper\ModuleHelper::renderModule() Same as call in the line below. 11 call_user_func_array() JROOT/libraries/src/Cache/Controller/CallbackController.php:173 10 Joomla\CMS\Cache\Controller\CallbackController->get() JROOT/libraries/src/Helper/ModuleHelper.php:617 9 Joomla\CMS\Helper\ModuleHelper::moduleCache() JROOT/libraries/src/Document/Renderer/Html/ModuleRenderer.php:95 8 Joomla\CMS\Document\Renderer\Html\ModuleRenderer->render() JROOT/libraries/src/Document/Renderer/Html/ModulesRenderer.php:47 7 Joomla\CMS\Document\Renderer\Html\ModulesRenderer->render() JROOT/libraries/src/Document/HtmlDocument.php:511 6 Joomla\CMS\Document\HtmlDocument->getBuffer() JROOT/libraries/src/Document/HtmlDocument.php:803 5 Joomla\CMS\Document\HtmlDocument->_renderTemplate() JROOT/libraries/src/Document/HtmlDocument.php:577 4 Joomla\CMS\Document\HtmlDocument->render() JROOT/libraries/src/Application/CMSApplication.php:1112 3 Joomla\CMS\Application\CMSApplication->render() JROOT/libraries/src/Application/SiteApplication.php:778 2 Joomla\CMS\Application\SiteApplication->render() JROOT/libraries/src/Application/CMSApplication.php:231 1 Joomla\CMS\Application\CMSApplication->execute() JROOT/index.php:49 - Query Time: 0.27 ms After last query: 1.02 ms Query memory: 0.008 MB Memory before query: 28.200 MB Rows returned: 0
SELECT *
FROM w0v41_k2_attachments
WHERE itemID=95id select_type table partitions type possible_keys key key_len ref rows filtered Extra 1 SIMPLE w0v41_k2_attachments NULL ref itemID itemID 4 const 1 100.00 NULL Status Duration starting 0.06 ms Executing hook on transaction 0.01 ms starting 0.01 ms checking permissions 0.01 ms Opening tables 0.02 ms init 0.01 ms System lock 0.01 ms optimizing 0.01 ms statistics 0.03 ms preparing 0.01 ms executing 0.02 ms end 0.01 ms query end 0.00 ms waiting for handler commit 0.01 ms closing tables 0.01 ms freeing items 0.05 ms cleaning up 0.01 ms # Caller File and line number 17 JDatabaseDriverMysqli->execute() JROOT/libraries/joomla/database/driver.php:1701 16 JDatabaseDriver->loadObjectList() JROOT/components/com_k2/models/item.php:1429 15 K2ModelItem->getItemAttachments() JROOT/modules/mod_k2_content/helper.php:437 14 modK2ContentHelper::getItems() JROOT/modules/mod_k2_content/mod_k2_content.php:65 13 include JROOT/modules/mod_k2_content/mod_k2_content.php JROOT/libraries/src/Helper/ModuleHelper.php:200 12 Joomla\CMS\Helper\ModuleHelper::renderModule() Same as call in the line below. 11 call_user_func_array() JROOT/libraries/src/Cache/Controller/CallbackController.php:173 10 Joomla\CMS\Cache\Controller\CallbackController->get() JROOT/libraries/src/Helper/ModuleHelper.php:617 9 Joomla\CMS\Helper\ModuleHelper::moduleCache() JROOT/libraries/src/Document/Renderer/Html/ModuleRenderer.php:95 8 Joomla\CMS\Document\Renderer\Html\ModuleRenderer->render() JROOT/libraries/src/Document/Renderer/Html/ModulesRenderer.php:47 7 Joomla\CMS\Document\Renderer\Html\ModulesRenderer->render() JROOT/libraries/src/Document/HtmlDocument.php:511 6 Joomla\CMS\Document\HtmlDocument->getBuffer() JROOT/libraries/src/Document/HtmlDocument.php:803 5 Joomla\CMS\Document\HtmlDocument->_renderTemplate() JROOT/libraries/src/Document/HtmlDocument.php:577 4 Joomla\CMS\Document\HtmlDocument->render() JROOT/libraries/src/Application/CMSApplication.php:1112 3 Joomla\CMS\Application\CMSApplication->render() JROOT/libraries/src/Application/SiteApplication.php:778 2 Joomla\CMS\Application\SiteApplication->render() JROOT/libraries/src/Application/CMSApplication.php:231 1 Joomla\CMS\Application\CMSApplication->execute() JROOT/index.php:49 - Query Time: 0.29 ms After last query: 0.02 ms Query memory: 0.008 MB Memory before query: 28.208 MB Rows returned: 1
SELECT COUNT(*)
FROM w0v41_k2_comments
WHERE itemID=95
AND published=1id select_type table partitions type possible_keys key key_len ref rows filtered Extra 1 SIMPLE w0v41_k2_comments NULL ref itemID,published,latestComments,countComments countComments 8 const,const 1 100.00 Using index Status Duration starting 0.06 ms Executing hook on transaction 0.01 ms starting 0.00 ms checking permissions 0.01 ms Opening tables 0.02 ms init 0.01 ms System lock 0.01 ms optimizing 0.01 ms statistics 0.05 ms preparing 0.02 ms executing 0.02 ms end 0.01 ms query end 0.01 ms waiting for handler commit 0.01 ms closing tables 0.01 ms freeing items 0.05 ms cleaning up 0.01 ms # Caller File and line number 17 JDatabaseDriverMysqli->execute() JROOT/libraries/joomla/database/driver.php:1740 16 JDatabaseDriver->loadResult() JROOT/components/com_k2/models/item.php:1468 15 K2ModelItem->countItemComments() JROOT/modules/mod_k2_content/helper.php:442 14 modK2ContentHelper::getItems() JROOT/modules/mod_k2_content/mod_k2_content.php:65 13 include JROOT/modules/mod_k2_content/mod_k2_content.php JROOT/libraries/src/Helper/ModuleHelper.php:200 12 Joomla\CMS\Helper\ModuleHelper::renderModule() Same as call in the line below. 11 call_user_func_array() JROOT/libraries/src/Cache/Controller/CallbackController.php:173 10 Joomla\CMS\Cache\Controller\CallbackController->get() JROOT/libraries/src/Helper/ModuleHelper.php:617 9 Joomla\CMS\Helper\ModuleHelper::moduleCache() JROOT/libraries/src/Document/Renderer/Html/ModuleRenderer.php:95 8 Joomla\CMS\Document\Renderer\Html\ModuleRenderer->render() JROOT/libraries/src/Document/Renderer/Html/ModulesRenderer.php:47 7 Joomla\CMS\Document\Renderer\Html\ModulesRenderer->render() JROOT/libraries/src/Document/HtmlDocument.php:511 6 Joomla\CMS\Document\HtmlDocument->getBuffer() JROOT/libraries/src/Document/HtmlDocument.php:803 5 Joomla\CMS\Document\HtmlDocument->_renderTemplate() JROOT/libraries/src/Document/HtmlDocument.php:577 4 Joomla\CMS\Document\HtmlDocument->render() JROOT/libraries/src/Application/CMSApplication.php:1112 3 Joomla\CMS\Application\CMSApplication->render() JROOT/libraries/src/Application/SiteApplication.php:778 2 Joomla\CMS\Application\SiteApplication->render() JROOT/libraries/src/Application/CMSApplication.php:231 1 Joomla\CMS\Application\CMSApplication->execute() JROOT/index.php:49 - Query Time: 0.37 ms After last query: 1.12 ms Query memory: 0.011 MB Memory before query: 28.234 MB Rows returned: 4
SELECT f.*
FROM w0v41_eventgallery_folder fid select_type table partitions type possible_keys key key_len ref rows filtered Extra 1 SIMPLE f NULL ALL NULL NO INDEX KEY COULD BE USED NULL NULL 4 100.00 NULL Status Duration starting 0.06 ms Executing hook on transaction 0.00 ms starting 0.01 ms checking permissions 0.01 ms Opening tables 0.03 ms init 0.01 ms System lock 0.01 ms optimizing 0.01 ms statistics 0.01 ms preparing 0.01 ms executing 0.10 ms end 0.01 ms query end 0.00 ms waiting for handler commit 0.01 ms closing tables 0.01 ms freeing items 0.06 ms cleaning up 0.01 ms # Caller File and line number 24 JDatabaseDriverMysqli->execute() JROOT/libraries/joomla/database/driver.php:1701 23 JDatabaseDriver->loadObjectList() JROOT/components/com_eventgallery/library/factory/folder.php:102 22 EventgalleryLibraryFactoryFolder->getAllFoldersFromDatabase() JROOT/components/com_eventgallery/library/factory/folder.php:67 21 EventgalleryLibraryFactoryFolder->getFolderFromDatabaseObject() JROOT/components/com_eventgallery/library/factory/folder.php:38 20 EventgalleryLibraryFactoryFolder->getFolder() JROOT/plugins/content/eventgallery/eventgallery.php:184 19 PlgContentEventgallery->handleEventTag() JROOT/plugins/content/eventgallery/eventgallery.php:110 18 PlgContentEventgallery->replace() JROOT/plugins/content/eventgallery/eventgallery.php:103 17 PlgContentEventgallery->onContentPrepare() JROOT/libraries/joomla/event/event.php:70 16 JEvent->update() JROOT/libraries/joomla/event/dispatcher.php:160 15 JEventDispatcher->trigger() JROOT/modules/mod_k2_content/helper.php:472 14 modK2ContentHelper::getItems() JROOT/modules/mod_k2_content/mod_k2_content.php:65 13 include JROOT/modules/mod_k2_content/mod_k2_content.php JROOT/libraries/src/Helper/ModuleHelper.php:200 12 Joomla\CMS\Helper\ModuleHelper::renderModule() Same as call in the line below. 11 call_user_func_array() JROOT/libraries/src/Cache/Controller/CallbackController.php:173 10 Joomla\CMS\Cache\Controller\CallbackController->get() JROOT/libraries/src/Helper/ModuleHelper.php:617 9 Joomla\CMS\Helper\ModuleHelper::moduleCache() JROOT/libraries/src/Document/Renderer/Html/ModuleRenderer.php:95 8 Joomla\CMS\Document\Renderer\Html\ModuleRenderer->render() JROOT/libraries/src/Document/Renderer/Html/ModulesRenderer.php:47 7 Joomla\CMS\Document\Renderer\Html\ModulesRenderer->render() JROOT/libraries/src/Document/HtmlDocument.php:511 6 Joomla\CMS\Document\HtmlDocument->getBuffer() JROOT/libraries/src/Document/HtmlDocument.php:803 5 Joomla\CMS\Document\HtmlDocument->_renderTemplate() JROOT/libraries/src/Document/HtmlDocument.php:577 4 Joomla\CMS\Document\HtmlDocument->render() JROOT/libraries/src/Application/CMSApplication.php:1112 3 Joomla\CMS\Application\CMSApplication->render() JROOT/libraries/src/Application/SiteApplication.php:778 2 Joomla\CMS\Application\SiteApplication->render() JROOT/libraries/src/Application/CMSApplication.php:231 1 Joomla\CMS\Application\CMSApplication->execute() JROOT/index.php:49 - Query Time: 2.48 ms After last query: 3.60 ms Query memory: 0.012 MB Memory before query: 28.429 MB Rows returned: 2
SELECT *
FROM w0v41_eventgallery_imagetypeset
ORDER BY `default` DESC,orderingid select_type table partitions type possible_keys key key_len ref rows filtered Extra 1 SIMPLE w0v41_eventgallery_imagetypeset NULL ALL NULL NO INDEX KEY COULD BE USED NULL NULL 2 100.00 Using filesort Status Duration starting 0.08 ms Executing hook on transaction 0.01 ms starting 0.01 ms checking permissions 0.01 ms Opening tables 1.45 ms init 0.01 ms System lock 0.01 ms optimizing 0.01 ms statistics 0.01 ms preparing 0.02 ms executing 0.04 ms end 0.01 ms query end 0.00 ms waiting for handler commit 0.01 ms closing tables 0.08 ms freeing items 0.06 ms cleaning up 0.01 ms # Caller File and line number 27 JDatabaseDriverMysqli->execute() JROOT/libraries/joomla/database/driver.php:1701 26 JDatabaseDriver->loadObjectList() JROOT/components/com_eventgallery/library/factory/imagetypeset.php:129 25 EventgalleryLibraryFactoryImagetypeset->getImageTypeSets() JROOT/components/com_eventgallery/library/factory/imagetypeset.php:169 24 EventgalleryLibraryFactoryImagetypeset->getImageTypeSet() JROOT/components/com_eventgallery/library/folder.php:177 23 EventgalleryLibraryFolder->_prepareData() JROOT/components/com_eventgallery/library/folder.php:94 22 EventgalleryLibraryFolder->__construct() JROOT/components/com_eventgallery/library/factory/folder.php:83 21 EventgalleryLibraryFactoryFolder->getFolderFromDatabaseObject() JROOT/components/com_eventgallery/library/factory/folder.php:38 20 EventgalleryLibraryFactoryFolder->getFolder() JROOT/plugins/content/eventgallery/eventgallery.php:184 19 PlgContentEventgallery->handleEventTag() JROOT/plugins/content/eventgallery/eventgallery.php:110 18 PlgContentEventgallery->replace() JROOT/plugins/content/eventgallery/eventgallery.php:103 17 PlgContentEventgallery->onContentPrepare() JROOT/libraries/joomla/event/event.php:70 16 JEvent->update() JROOT/libraries/joomla/event/dispatcher.php:160 15 JEventDispatcher->trigger() JROOT/modules/mod_k2_content/helper.php:472 14 modK2ContentHelper::getItems() JROOT/modules/mod_k2_content/mod_k2_content.php:65 13 include JROOT/modules/mod_k2_content/mod_k2_content.php JROOT/libraries/src/Helper/ModuleHelper.php:200 12 Joomla\CMS\Helper\ModuleHelper::renderModule() Same as call in the line below. 11 call_user_func_array() JROOT/libraries/src/Cache/Controller/CallbackController.php:173 10 Joomla\CMS\Cache\Controller\CallbackController->get() JROOT/libraries/src/Helper/ModuleHelper.php:617 9 Joomla\CMS\Helper\ModuleHelper::moduleCache() JROOT/libraries/src/Document/Renderer/Html/ModuleRenderer.php:95 8 Joomla\CMS\Document\Renderer\Html\ModuleRenderer->render() JROOT/libraries/src/Document/Renderer/Html/ModulesRenderer.php:47 7 Joomla\CMS\Document\Renderer\Html\ModulesRenderer->render() JROOT/libraries/src/Document/HtmlDocument.php:511 6 Joomla\CMS\Document\HtmlDocument->getBuffer() JROOT/libraries/src/Document/HtmlDocument.php:803 5 Joomla\CMS\Document\HtmlDocument->_renderTemplate() JROOT/libraries/src/Document/HtmlDocument.php:577 4 Joomla\CMS\Document\HtmlDocument->render() JROOT/libraries/src/Application/CMSApplication.php:1112 3 Joomla\CMS\Application\CMSApplication->render() JROOT/libraries/src/Application/SiteApplication.php:778 2 Joomla\CMS\Application\SiteApplication->render() JROOT/libraries/src/Application/CMSApplication.php:231 1 Joomla\CMS\Application\CMSApplication->execute() JROOT/index.php:49 - Query Time: 2.60 ms After last query: 0.84 ms Query memory: 0.013 MB Memory before query: 28.526 MB Rows returned: 3
SELECT t.*
FROM w0v41_eventgallery_imagetypeset_imagetype tsta
left join w0v41_eventgallery_imagetype t
on tsta.imagetypeid=t.id
WHERE tsta.imagetypesetid='2'
ORDER BY tsta.orderingid select_type table partitions type possible_keys key key_len ref rows filtered Extra 1 SIMPLE tsta NULL ref PRIMARY PRIMARY 4 const 3 100.00 Using filesort 1 SIMPLE t NULL eq_ref PRIMARY PRIMARY 4 h88876_SDAT.tsta.imagetypeid 1 100.00 NULL Status Duration starting 0.08 ms Executing hook on transaction 0.01 ms starting 0.01 ms checking permissions 0.00 ms checking permissions 0.00 ms Opening tables 2.06 ms init 0.01 ms System lock 0.01 ms optimizing 0.02 ms statistics 0.04 ms preparing 0.02 ms executing 0.07 ms end 0.01 ms query end 0.00 ms waiting for handler commit 0.01 ms closing tables 0.16 ms freeing items 0.06 ms cleaning up 0.01 ms # Caller File and line number 29 JDatabaseDriverMysqli->execute() JROOT/libraries/joomla/database/driver.php:1701 28 JDatabaseDriver->loadObjectList() JROOT/components/com_eventgallery/library/factory/imagetypeset.php:66 27 EventgalleryLibraryFactoryImagetypeset->getImagetypes() JROOT/components/com_eventgallery/library/imagetypeset.php:59 26 EventgalleryLibraryImagetypeset->__construct() JROOT/components/com_eventgallery/library/factory/imagetypeset.php:138 25 EventgalleryLibraryFactoryImagetypeset->getImageTypeSets() JROOT/components/com_eventgallery/library/factory/imagetypeset.php:169 24 EventgalleryLibraryFactoryImagetypeset->getImageTypeSet() JROOT/components/com_eventgallery/library/folder.php:177 23 EventgalleryLibraryFolder->_prepareData() JROOT/components/com_eventgallery/library/folder.php:94 22 EventgalleryLibraryFolder->__construct() JROOT/components/com_eventgallery/library/factory/folder.php:83 21 EventgalleryLibraryFactoryFolder->getFolderFromDatabaseObject() JROOT/components/com_eventgallery/library/factory/folder.php:38 20 EventgalleryLibraryFactoryFolder->getFolder() JROOT/plugins/content/eventgallery/eventgallery.php:184 19 PlgContentEventgallery->handleEventTag() JROOT/plugins/content/eventgallery/eventgallery.php:110 18 PlgContentEventgallery->replace() JROOT/plugins/content/eventgallery/eventgallery.php:103 17 PlgContentEventgallery->onContentPrepare() JROOT/libraries/joomla/event/event.php:70 16 JEvent->update() JROOT/libraries/joomla/event/dispatcher.php:160 15 JEventDispatcher->trigger() JROOT/modules/mod_k2_content/helper.php:472 14 modK2ContentHelper::getItems() JROOT/modules/mod_k2_content/mod_k2_content.php:65 13 include JROOT/modules/mod_k2_content/mod_k2_content.php JROOT/libraries/src/Helper/ModuleHelper.php:200 12 Joomla\CMS\Helper\ModuleHelper::renderModule() Same as call in the line below. 11 call_user_func_array() JROOT/libraries/src/Cache/Controller/CallbackController.php:173 10 Joomla\CMS\Cache\Controller\CallbackController->get() JROOT/libraries/src/Helper/ModuleHelper.php:617 9 Joomla\CMS\Helper\ModuleHelper::moduleCache() JROOT/libraries/src/Document/Renderer/Html/ModuleRenderer.php:95 8 Joomla\CMS\Document\Renderer\Html\ModuleRenderer->render() JROOT/libraries/src/Document/Renderer/Html/ModulesRenderer.php:47 7 Joomla\CMS\Document\Renderer\Html\ModulesRenderer->render() JROOT/libraries/src/Document/HtmlDocument.php:511 6 Joomla\CMS\Document\HtmlDocument->getBuffer() JROOT/libraries/src/Document/HtmlDocument.php:803 5 Joomla\CMS\Document\HtmlDocument->_renderTemplate() JROOT/libraries/src/Document/HtmlDocument.php:577 4 Joomla\CMS\Document\HtmlDocument->render() JROOT/libraries/src/Application/CMSApplication.php:1112 3 Joomla\CMS\Application\CMSApplication->render() JROOT/libraries/src/Application/SiteApplication.php:778 2 Joomla\CMS\Application\SiteApplication->render() JROOT/libraries/src/Application/CMSApplication.php:231 1 Joomla\CMS\Application\CMSApplication->execute() JROOT/index.php:49 - Query Time: 0.30 ms After last query: 0.06 ms Query memory: 0.013 MB Memory before query: 28.550 MB Rows returned: 6
SELECT *
FROM w0v41_eventgallery_imagetypeid select_type table partitions type possible_keys key key_len ref rows filtered Extra 1 SIMPLE w0v41_eventgallery_imagetype NULL ALL NULL NO INDEX KEY COULD BE USED NULL NULL 6 100.00 NULL Status Duration starting 0.06 ms Executing hook on transaction 0.00 ms starting 0.01 ms checking permissions 0.01 ms Opening tables 0.02 ms init 0.00 ms System lock 0.01 ms optimizing 0.01 ms statistics 0.01 ms preparing 0.01 ms executing 0.06 ms end 0.01 ms query end 0.00 ms waiting for handler commit 0.01 ms closing tables 0.01 ms freeing items 0.05 ms cleaning up 0.01 ms # Caller File and line number 31 JDatabaseDriverMysqli->execute() JROOT/libraries/joomla/database/driver.php:1701 30 JDatabaseDriver->loadObjectList() JROOT/components/com_eventgallery/library/factory/imagetype.php:51 29 EventgalleryLibraryFactoryImagetype->getImageTypes() JROOT/components/com_eventgallery/library/factory/imagetype.php:27 28 EventgalleryLibraryFactoryImagetype->getImagetypeById() JROOT/components/com_eventgallery/library/factory/imagetypeset.php:70 27 EventgalleryLibraryFactoryImagetypeset->getImagetypes() JROOT/components/com_eventgallery/library/imagetypeset.php:59 26 EventgalleryLibraryImagetypeset->__construct() JROOT/components/com_eventgallery/library/factory/imagetypeset.php:138 25 EventgalleryLibraryFactoryImagetypeset->getImageTypeSets() JROOT/components/com_eventgallery/library/factory/imagetypeset.php:169 24 EventgalleryLibraryFactoryImagetypeset->getImageTypeSet() JROOT/components/com_eventgallery/library/folder.php:177 23 EventgalleryLibraryFolder->_prepareData() JROOT/components/com_eventgallery/library/folder.php:94 22 EventgalleryLibraryFolder->__construct() JROOT/components/com_eventgallery/library/factory/folder.php:83 21 EventgalleryLibraryFactoryFolder->getFolderFromDatabaseObject() JROOT/components/com_eventgallery/library/factory/folder.php:38 20 EventgalleryLibraryFactoryFolder->getFolder() JROOT/plugins/content/eventgallery/eventgallery.php:184 19 PlgContentEventgallery->handleEventTag() JROOT/plugins/content/eventgallery/eventgallery.php:110 18 PlgContentEventgallery->replace() JROOT/plugins/content/eventgallery/eventgallery.php:103 17 PlgContentEventgallery->onContentPrepare() JROOT/libraries/joomla/event/event.php:70 16 JEvent->update() JROOT/libraries/joomla/event/dispatcher.php:160 15 JEventDispatcher->trigger() JROOT/modules/mod_k2_content/helper.php:472 14 modK2ContentHelper::getItems() JROOT/modules/mod_k2_content/mod_k2_content.php:65 13 include JROOT/modules/mod_k2_content/mod_k2_content.php JROOT/libraries/src/Helper/ModuleHelper.php:200 12 Joomla\CMS\Helper\ModuleHelper::renderModule() Same as call in the line below. 11 call_user_func_array() JROOT/libraries/src/Cache/Controller/CallbackController.php:173 10 Joomla\CMS\Cache\Controller\CallbackController->get() JROOT/libraries/src/Helper/ModuleHelper.php:617 9 Joomla\CMS\Helper\ModuleHelper::moduleCache() JROOT/libraries/src/Document/Renderer/Html/ModuleRenderer.php:95 8 Joomla\CMS\Document\Renderer\Html\ModuleRenderer->render() JROOT/libraries/src/Document/Renderer/Html/ModulesRenderer.php:47 7 Joomla\CMS\Document\Renderer\Html\ModulesRenderer->render() JROOT/libraries/src/Document/HtmlDocument.php:511 6 Joomla\CMS\Document\HtmlDocument->getBuffer() JROOT/libraries/src/Document/HtmlDocument.php:803 5 Joomla\CMS\Document\HtmlDocument->_renderTemplate() JROOT/libraries/src/Document/HtmlDocument.php:577 4 Joomla\CMS\Document\HtmlDocument->render() JROOT/libraries/src/Application/CMSApplication.php:1112 3 Joomla\CMS\Application\CMSApplication->render() JROOT/libraries/src/Application/SiteApplication.php:778 2 Joomla\CMS\Application\SiteApplication->render() JROOT/libraries/src/Application/CMSApplication.php:231 1 Joomla\CMS\Application\CMSApplication->execute() JROOT/index.php:49 - Query Time: 0.39 ms After last query: 0.66 ms Query memory: 0.013 MB Memory before query: 28.627 MB Rows returned: 2
SELECT t.*
FROM w0v41_eventgallery_imagetypeset_imagetype tsta
left join w0v41_eventgallery_imagetype t
on tsta.imagetypeid=t.id
WHERE tsta.imagetypesetid='2'
AND published=1
ORDER BY tsta.orderingid select_type table partitions type possible_keys key key_len ref rows filtered Extra 1 SIMPLE tsta NULL ref PRIMARY PRIMARY 4 const 3 100.00 Using filesort 1 SIMPLE t NULL eq_ref PRIMARY PRIMARY 4 h88876_SDAT.tsta.imagetypeid 1 16.67 Using where Status Duration starting 0.08 ms Executing hook on transaction 0.00 ms starting 0.01 ms checking permissions 0.00 ms checking permissions 0.00 ms Opening tables 0.03 ms init 0.01 ms System lock 0.01 ms optimizing 0.01 ms statistics 0.04 ms preparing 0.02 ms executing 0.06 ms end 0.01 ms query end 0.01 ms waiting for handler commit 0.01 ms closing tables 0.01 ms freeing items 0.07 ms cleaning up 0.01 ms # Caller File and line number 29 JDatabaseDriverMysqli->execute() JROOT/libraries/joomla/database/driver.php:1701 28 JDatabaseDriver->loadObjectList() JROOT/components/com_eventgallery/library/factory/imagetypeset.php:66 27 EventgalleryLibraryFactoryImagetypeset->getImagetypes() JROOT/components/com_eventgallery/library/imagetypeset.php:60 26 EventgalleryLibraryImagetypeset->__construct() JROOT/components/com_eventgallery/library/factory/imagetypeset.php:138 25 EventgalleryLibraryFactoryImagetypeset->getImageTypeSets() JROOT/components/com_eventgallery/library/factory/imagetypeset.php:169 24 EventgalleryLibraryFactoryImagetypeset->getImageTypeSet() JROOT/components/com_eventgallery/library/folder.php:177 23 EventgalleryLibraryFolder->_prepareData() JROOT/components/com_eventgallery/library/folder.php:94 22 EventgalleryLibraryFolder->__construct() JROOT/components/com_eventgallery/library/factory/folder.php:83 21 EventgalleryLibraryFactoryFolder->getFolderFromDatabaseObject() JROOT/components/com_eventgallery/library/factory/folder.php:38 20 EventgalleryLibraryFactoryFolder->getFolder() JROOT/plugins/content/eventgallery/eventgallery.php:184 19 PlgContentEventgallery->handleEventTag() JROOT/plugins/content/eventgallery/eventgallery.php:110 18 PlgContentEventgallery->replace() JROOT/plugins/content/eventgallery/eventgallery.php:103 17 PlgContentEventgallery->onContentPrepare() JROOT/libraries/joomla/event/event.php:70 16 JEvent->update() JROOT/libraries/joomla/event/dispatcher.php:160 15 JEventDispatcher->trigger() JROOT/modules/mod_k2_content/helper.php:472 14 modK2ContentHelper::getItems() JROOT/modules/mod_k2_content/mod_k2_content.php:65 13 include JROOT/modules/mod_k2_content/mod_k2_content.php JROOT/libraries/src/Helper/ModuleHelper.php:200 12 Joomla\CMS\Helper\ModuleHelper::renderModule() Same as call in the line below. 11 call_user_func_array() JROOT/libraries/src/Cache/Controller/CallbackController.php:173 10 Joomla\CMS\Cache\Controller\CallbackController->get() JROOT/libraries/src/Helper/ModuleHelper.php:617 9 Joomla\CMS\Helper\ModuleHelper::moduleCache() JROOT/libraries/src/Document/Renderer/Html/ModuleRenderer.php:95 8 Joomla\CMS\Document\Renderer\Html\ModuleRenderer->render() JROOT/libraries/src/Document/Renderer/Html/ModulesRenderer.php:47 7 Joomla\CMS\Document\Renderer\Html\ModulesRenderer->render() JROOT/libraries/src/Document/HtmlDocument.php:511 6 Joomla\CMS\Document\HtmlDocument->getBuffer() JROOT/libraries/src/Document/HtmlDocument.php:803 5 Joomla\CMS\Document\HtmlDocument->_renderTemplate() JROOT/libraries/src/Document/HtmlDocument.php:577 4 Joomla\CMS\Document\HtmlDocument->render() JROOT/libraries/src/Application/CMSApplication.php:1112 3 Joomla\CMS\Application\CMSApplication->render() JROOT/libraries/src/Application/SiteApplication.php:778 2 Joomla\CMS\Application\SiteApplication->render() JROOT/libraries/src/Application/CMSApplication.php:231 1 Joomla\CMS\Application\CMSApplication->execute() JROOT/index.php:49 - Query Time: 0.35 ms After last query: 0.04 ms Query memory: 0.013 MB Memory before query: 28.640 MB Rows returned: 3
SELECT t.*, tsta.default as defaultimagetype
FROM w0v41_eventgallery_imagetypeset_imagetype tsta
left join w0v41_eventgallery_imagetype t
on tsta.imagetypeid=t.id
WHERE tsta.imagetypesetid='2'
ORDER BY tsta.orderingid select_type table partitions type possible_keys key key_len ref rows filtered Extra 1 SIMPLE tsta NULL ref PRIMARY PRIMARY 4 const 3 100.00 Using filesort 1 SIMPLE t NULL eq_ref PRIMARY PRIMARY 4 h88876_SDAT.tsta.imagetypeid 1 100.00 NULL Status Duration starting 0.07 ms Executing hook on transaction 0.01 ms starting 0.01 ms checking permissions 0.00 ms checking permissions 0.00 ms Opening tables 0.03 ms init 0.01 ms System lock 0.01 ms optimizing 0.01 ms statistics 0.03 ms preparing 0.02 ms executing 0.06 ms end 0.01 ms query end 0.00 ms waiting for handler commit 0.01 ms closing tables 0.01 ms freeing items 0.06 ms cleaning up 0.01 ms # Caller File and line number 29 JDatabaseDriverMysqli->execute() JROOT/libraries/joomla/database/driver.php:1701 28 JDatabaseDriver->loadObjectList() JROOT/components/com_eventgallery/library/factory/imagetypeset.php:93 27 EventgalleryLibraryFactoryImagetypeset->getDefaultImagetype() JROOT/components/com_eventgallery/library/imagetypeset.php:61 26 EventgalleryLibraryImagetypeset->__construct() JROOT/components/com_eventgallery/library/factory/imagetypeset.php:138 25 EventgalleryLibraryFactoryImagetypeset->getImageTypeSets() JROOT/components/com_eventgallery/library/factory/imagetypeset.php:169 24 EventgalleryLibraryFactoryImagetypeset->getImageTypeSet() JROOT/components/com_eventgallery/library/folder.php:177 23 EventgalleryLibraryFolder->_prepareData() JROOT/components/com_eventgallery/library/folder.php:94 22 EventgalleryLibraryFolder->__construct() JROOT/components/com_eventgallery/library/factory/folder.php:83 21 EventgalleryLibraryFactoryFolder->getFolderFromDatabaseObject() JROOT/components/com_eventgallery/library/factory/folder.php:38 20 EventgalleryLibraryFactoryFolder->getFolder() JROOT/plugins/content/eventgallery/eventgallery.php:184 19 PlgContentEventgallery->handleEventTag() JROOT/plugins/content/eventgallery/eventgallery.php:110 18 PlgContentEventgallery->replace() JROOT/plugins/content/eventgallery/eventgallery.php:103 17 PlgContentEventgallery->onContentPrepare() JROOT/libraries/joomla/event/event.php:70 16 JEvent->update() JROOT/libraries/joomla/event/dispatcher.php:160 15 JEventDispatcher->trigger() JROOT/modules/mod_k2_content/helper.php:472 14 modK2ContentHelper::getItems() JROOT/modules/mod_k2_content/mod_k2_content.php:65 13 include JROOT/modules/mod_k2_content/mod_k2_content.php JROOT/libraries/src/Helper/ModuleHelper.php:200 12 Joomla\CMS\Helper\ModuleHelper::renderModule() Same as call in the line below. 11 call_user_func_array() JROOT/libraries/src/Cache/Controller/CallbackController.php:173 10 Joomla\CMS\Cache\Controller\CallbackController->get() JROOT/libraries/src/Helper/ModuleHelper.php:617 9 Joomla\CMS\Helper\ModuleHelper::moduleCache() JROOT/libraries/src/Document/Renderer/Html/ModuleRenderer.php:95 8 Joomla\CMS\Document\Renderer\Html\ModuleRenderer->render() JROOT/libraries/src/Document/Renderer/Html/ModulesRenderer.php:47 7 Joomla\CMS\Document\Renderer\Html\ModulesRenderer->render() JROOT/libraries/src/Document/HtmlDocument.php:511 6 Joomla\CMS\Document\HtmlDocument->getBuffer() JROOT/libraries/src/Document/HtmlDocument.php:803 5 Joomla\CMS\Document\HtmlDocument->_renderTemplate() JROOT/libraries/src/Document/HtmlDocument.php:577 4 Joomla\CMS\Document\HtmlDocument->render() JROOT/libraries/src/Application/CMSApplication.php:1112 3 Joomla\CMS\Application\CMSApplication->render() JROOT/libraries/src/Application/SiteApplication.php:778 2 Joomla\CMS\Application\SiteApplication->render() JROOT/libraries/src/Application/CMSApplication.php:231 1 Joomla\CMS\Application\CMSApplication->execute() JROOT/index.php:49 - Query Time: 0.35 ms After last query: 0.05 ms Query memory: 0.013 MB Memory before query: 28.654 MB Rows returned: 4
SELECT t.*
FROM w0v41_eventgallery_imagetypeset_imagetype tsta
left join w0v41_eventgallery_imagetype t
on tsta.imagetypeid=t.id
WHERE tsta.imagetypesetid='1'
ORDER BY tsta.orderingid select_type table partitions type possible_keys key key_len ref rows filtered Extra 1 SIMPLE tsta NULL ref PRIMARY PRIMARY 4 const 4 100.00 Using filesort 1 SIMPLE t NULL eq_ref PRIMARY PRIMARY 4 h88876_SDAT.tsta.imagetypeid 1 100.00 NULL Status Duration starting 0.07 ms Executing hook on transaction 0.01 ms starting 0.01 ms checking permissions 0.01 ms checking permissions 0.01 ms Opening tables 0.03 ms init 0.01 ms System lock 0.01 ms optimizing 0.01 ms statistics 0.03 ms preparing 0.01 ms executing 0.06 ms end 0.01 ms query end 0.00 ms waiting for handler commit 0.01 ms closing tables 0.01 ms freeing items 0.06 ms cleaning up 0.01 ms # Caller File and line number 29 JDatabaseDriverMysqli->execute() JROOT/libraries/joomla/database/driver.php:1701 28 JDatabaseDriver->loadObjectList() JROOT/components/com_eventgallery/library/factory/imagetypeset.php:66 27 EventgalleryLibraryFactoryImagetypeset->getImagetypes() JROOT/components/com_eventgallery/library/imagetypeset.php:59 26 EventgalleryLibraryImagetypeset->__construct() JROOT/components/com_eventgallery/library/factory/imagetypeset.php:138 25 EventgalleryLibraryFactoryImagetypeset->getImageTypeSets() JROOT/components/com_eventgallery/library/factory/imagetypeset.php:169 24 EventgalleryLibraryFactoryImagetypeset->getImageTypeSet() JROOT/components/com_eventgallery/library/folder.php:177 23 EventgalleryLibraryFolder->_prepareData() JROOT/components/com_eventgallery/library/folder.php:94 22 EventgalleryLibraryFolder->__construct() JROOT/components/com_eventgallery/library/factory/folder.php:83 21 EventgalleryLibraryFactoryFolder->getFolderFromDatabaseObject() JROOT/components/com_eventgallery/library/factory/folder.php:38 20 EventgalleryLibraryFactoryFolder->getFolder() JROOT/plugins/content/eventgallery/eventgallery.php:184 19 PlgContentEventgallery->handleEventTag() JROOT/plugins/content/eventgallery/eventgallery.php:110 18 PlgContentEventgallery->replace() JROOT/plugins/content/eventgallery/eventgallery.php:103 17 PlgContentEventgallery->onContentPrepare() JROOT/libraries/joomla/event/event.php:70 16 JEvent->update() JROOT/libraries/joomla/event/dispatcher.php:160 15 JEventDispatcher->trigger() JROOT/modules/mod_k2_content/helper.php:472 14 modK2ContentHelper::getItems() JROOT/modules/mod_k2_content/mod_k2_content.php:65 13 include JROOT/modules/mod_k2_content/mod_k2_content.php JROOT/libraries/src/Helper/ModuleHelper.php:200 12 Joomla\CMS\Helper\ModuleHelper::renderModule() Same as call in the line below. 11 call_user_func_array() JROOT/libraries/src/Cache/Controller/CallbackController.php:173 10 Joomla\CMS\Cache\Controller\CallbackController->get() JROOT/libraries/src/Helper/ModuleHelper.php:617 9 Joomla\CMS\Helper\ModuleHelper::moduleCache() JROOT/libraries/src/Document/Renderer/Html/ModuleRenderer.php:95 8 Joomla\CMS\Document\Renderer\Html\ModuleRenderer->render() JROOT/libraries/src/Document/Renderer/Html/ModulesRenderer.php:47 7 Joomla\CMS\Document\Renderer\Html\ModulesRenderer->render() JROOT/libraries/src/Document/HtmlDocument.php:511 6 Joomla\CMS\Document\HtmlDocument->getBuffer() JROOT/libraries/src/Document/HtmlDocument.php:803 5 Joomla\CMS\Document\HtmlDocument->_renderTemplate() JROOT/libraries/src/Document/HtmlDocument.php:577 4 Joomla\CMS\Document\HtmlDocument->render() JROOT/libraries/src/Application/CMSApplication.php:1112 3 Joomla\CMS\Application\CMSApplication->render() JROOT/libraries/src/Application/SiteApplication.php:778 2 Joomla\CMS\Application\SiteApplication->render() JROOT/libraries/src/Application/CMSApplication.php:231 1 Joomla\CMS\Application\CMSApplication->execute() JROOT/index.php:49 - Query Time: 0.57 ms After last query: 0.03 ms Query memory: 0.013 MB Memory before query: 28.667 MB Rows returned: 3
SELECT t.*
FROM w0v41_eventgallery_imagetypeset_imagetype tsta
left join w0v41_eventgallery_imagetype t
on tsta.imagetypeid=t.id
WHERE tsta.imagetypesetid='1'
AND published=1
ORDER BY tsta.orderingid select_type table partitions type possible_keys key key_len ref rows filtered Extra 1 SIMPLE tsta NULL ref PRIMARY PRIMARY 4 const 4 100.00 Using temporary; Using filesort 1 SIMPLE t NULL ALL PRIMARY NO INDEX KEY COULD BE USED NULL NULL 6 16.67 Using where; Using join buffer (hash join) Status Duration starting 0.08 ms Executing hook on transaction 0.01 ms starting 0.03 ms checking permissions 0.01 ms checking permissions 0.01 ms Opening tables 0.03 ms init 0.01 ms System lock 0.01 ms optimizing 0.01 ms statistics 0.03 ms preparing 0.01 ms Creating tmp table 0.14 ms executing 0.10 ms end 0.01 ms query end 0.00 ms waiting for handler commit 0.01 ms closing tables 0.01 ms freeing items 0.06 ms cleaning up 0.01 ms # Caller File and line number 29 JDatabaseDriverMysqli->execute() JROOT/libraries/joomla/database/driver.php:1701 28 JDatabaseDriver->loadObjectList() JROOT/components/com_eventgallery/library/factory/imagetypeset.php:66 27 EventgalleryLibraryFactoryImagetypeset->getImagetypes() JROOT/components/com_eventgallery/library/imagetypeset.php:60 26 EventgalleryLibraryImagetypeset->__construct() JROOT/components/com_eventgallery/library/factory/imagetypeset.php:138 25 EventgalleryLibraryFactoryImagetypeset->getImageTypeSets() JROOT/components/com_eventgallery/library/factory/imagetypeset.php:169 24 EventgalleryLibraryFactoryImagetypeset->getImageTypeSet() JROOT/components/com_eventgallery/library/folder.php:177 23 EventgalleryLibraryFolder->_prepareData() JROOT/components/com_eventgallery/library/folder.php:94 22 EventgalleryLibraryFolder->__construct() JROOT/components/com_eventgallery/library/factory/folder.php:83 21 EventgalleryLibraryFactoryFolder->getFolderFromDatabaseObject() JROOT/components/com_eventgallery/library/factory/folder.php:38 20 EventgalleryLibraryFactoryFolder->getFolder() JROOT/plugins/content/eventgallery/eventgallery.php:184 19 PlgContentEventgallery->handleEventTag() JROOT/plugins/content/eventgallery/eventgallery.php:110 18 PlgContentEventgallery->replace() JROOT/plugins/content/eventgallery/eventgallery.php:103 17 PlgContentEventgallery->onContentPrepare() JROOT/libraries/joomla/event/event.php:70 16 JEvent->update() JROOT/libraries/joomla/event/dispatcher.php:160 15 JEventDispatcher->trigger() JROOT/modules/mod_k2_content/helper.php:472 14 modK2ContentHelper::getItems() JROOT/modules/mod_k2_content/mod_k2_content.php:65 13 include JROOT/modules/mod_k2_content/mod_k2_content.php JROOT/libraries/src/Helper/ModuleHelper.php:200 12 Joomla\CMS\Helper\ModuleHelper::renderModule() Same as call in the line below. 11 call_user_func_array() JROOT/libraries/src/Cache/Controller/CallbackController.php:173 10 Joomla\CMS\Cache\Controller\CallbackController->get() JROOT/libraries/src/Helper/ModuleHelper.php:617 9 Joomla\CMS\Helper\ModuleHelper::moduleCache() JROOT/libraries/src/Document/Renderer/Html/ModuleRenderer.php:95 8 Joomla\CMS\Document\Renderer\Html\ModuleRenderer->render() JROOT/libraries/src/Document/Renderer/Html/ModulesRenderer.php:47 7 Joomla\CMS\Document\Renderer\Html\ModulesRenderer->render() JROOT/libraries/src/Document/HtmlDocument.php:511 6 Joomla\CMS\Document\HtmlDocument->getBuffer() JROOT/libraries/src/Document/HtmlDocument.php:803 5 Joomla\CMS\Document\HtmlDocument->_renderTemplate() JROOT/libraries/src/Document/HtmlDocument.php:577 4 Joomla\CMS\Document\HtmlDocument->render() JROOT/libraries/src/Application/CMSApplication.php:1112 3 Joomla\CMS\Application\CMSApplication->render() JROOT/libraries/src/Application/SiteApplication.php:778 2 Joomla\CMS\Application\SiteApplication->render() JROOT/libraries/src/Application/CMSApplication.php:231 1 Joomla\CMS\Application\CMSApplication->execute() JROOT/index.php:49 - Query Time: 0.36 ms After last query: 0.07 ms Query memory: 0.013 MB Memory before query: 28.680 MB Rows returned: 4
SELECT t.*, tsta.default as defaultimagetype
FROM w0v41_eventgallery_imagetypeset_imagetype tsta
left join w0v41_eventgallery_imagetype t
on tsta.imagetypeid=t.id
WHERE tsta.imagetypesetid='1'
ORDER BY tsta.orderingid select_type table partitions type possible_keys key key_len ref rows filtered Extra 1 SIMPLE tsta NULL ref PRIMARY PRIMARY 4 const 4 100.00 Using filesort 1 SIMPLE t NULL eq_ref PRIMARY PRIMARY 4 h88876_SDAT.tsta.imagetypeid 1 100.00 NULL Status Duration starting 0.08 ms Executing hook on transaction 0.01 ms starting 0.01 ms checking permissions 0.00 ms checking permissions 0.00 ms Opening tables 0.03 ms init 0.01 ms System lock 0.01 ms optimizing 0.01 ms statistics 0.03 ms preparing 0.01 ms executing 0.06 ms end 0.01 ms query end 0.01 ms waiting for handler commit 0.01 ms closing tables 0.01 ms freeing items 0.05 ms cleaning up 0.01 ms # Caller File and line number 29 JDatabaseDriverMysqli->execute() JROOT/libraries/joomla/database/driver.php:1701 28 JDatabaseDriver->loadObjectList() JROOT/components/com_eventgallery/library/factory/imagetypeset.php:93 27 EventgalleryLibraryFactoryImagetypeset->getDefaultImagetype() JROOT/components/com_eventgallery/library/imagetypeset.php:61 26 EventgalleryLibraryImagetypeset->__construct() JROOT/components/com_eventgallery/library/factory/imagetypeset.php:138 25 EventgalleryLibraryFactoryImagetypeset->getImageTypeSets() JROOT/components/com_eventgallery/library/factory/imagetypeset.php:169 24 EventgalleryLibraryFactoryImagetypeset->getImageTypeSet() JROOT/components/com_eventgallery/library/folder.php:177 23 EventgalleryLibraryFolder->_prepareData() JROOT/components/com_eventgallery/library/folder.php:94 22 EventgalleryLibraryFolder->__construct() JROOT/components/com_eventgallery/library/factory/folder.php:83 21 EventgalleryLibraryFactoryFolder->getFolderFromDatabaseObject() JROOT/components/com_eventgallery/library/factory/folder.php:38 20 EventgalleryLibraryFactoryFolder->getFolder() JROOT/plugins/content/eventgallery/eventgallery.php:184 19 PlgContentEventgallery->handleEventTag() JROOT/plugins/content/eventgallery/eventgallery.php:110 18 PlgContentEventgallery->replace() JROOT/plugins/content/eventgallery/eventgallery.php:103 17 PlgContentEventgallery->onContentPrepare() JROOT/libraries/joomla/event/event.php:70 16 JEvent->update() JROOT/libraries/joomla/event/dispatcher.php:160 15 JEventDispatcher->trigger() JROOT/modules/mod_k2_content/helper.php:472 14 modK2ContentHelper::getItems() JROOT/modules/mod_k2_content/mod_k2_content.php:65 13 include JROOT/modules/mod_k2_content/mod_k2_content.php JROOT/libraries/src/Helper/ModuleHelper.php:200 12 Joomla\CMS\Helper\ModuleHelper::renderModule() Same as call in the line below. 11 call_user_func_array() JROOT/libraries/src/Cache/Controller/CallbackController.php:173 10 Joomla\CMS\Cache\Controller\CallbackController->get() JROOT/libraries/src/Helper/ModuleHelper.php:617 9 Joomla\CMS\Helper\ModuleHelper::moduleCache() JROOT/libraries/src/Document/Renderer/Html/ModuleRenderer.php:95 8 Joomla\CMS\Document\Renderer\Html\ModuleRenderer->render() JROOT/libraries/src/Document/Renderer/Html/ModulesRenderer.php:47 7 Joomla\CMS\Document\Renderer\Html\ModulesRenderer->render() JROOT/libraries/src/Document/HtmlDocument.php:511 6 Joomla\CMS\Document\HtmlDocument->getBuffer() JROOT/libraries/src/Document/HtmlDocument.php:803 5 Joomla\CMS\Document\HtmlDocument->_renderTemplate() JROOT/libraries/src/Document/HtmlDocument.php:577 4 Joomla\CMS\Document\HtmlDocument->render() JROOT/libraries/src/Application/CMSApplication.php:1112 3 Joomla\CMS\Application\CMSApplication->render() JROOT/libraries/src/Application/SiteApplication.php:778 2 Joomla\CMS\Application\SiteApplication->render() JROOT/libraries/src/Application/CMSApplication.php:231 1 Joomla\CMS\Application\CMSApplication->execute() JROOT/index.php:49 - Query Time: 0.75 ms After last query: 0.83 ms Query memory: 0.010 MB Memory before query: 28.702 MB Rows returned: 20
SELECT file.*
FROM `w0v41_eventgallery_file` AS file
WHERE file.folder='DNS98'
AND file.published=1
AND file.ismainimageonly=0
GROUP BY file.id
ORDER BY `ordering` ASC,ordering DESC, file.file
LIMIT 20id select_type table partitions type possible_keys key key_len ref rows filtered Extra 1 SIMPLE file NULL ref PRIMARY,file,index_file,index_folder file 377 const 53 1.00 Using where; Using filesort Status Duration starting 0.09 ms Executing hook on transaction 0.01 ms starting 0.01 ms checking permissions 0.01 ms Opening tables 0.05 ms init 0.01 ms System lock 0.01 ms optimizing 0.01 ms statistics 0.06 ms preparing 0.03 ms executing 0.34 ms end 0.01 ms query end 0.00 ms waiting for handler commit 0.01 ms closing tables 0.01 ms freeing items 0.06 ms cleaning up 0.01 ms # Caller File and line number 22 JDatabaseDriverMysqli->execute() JROOT/libraries/joomla/database/driver.php:1701 21 JDatabaseDriver->loadObjectList() JROOT/components/com_eventgallery/library/folder.php:549 20 EventgalleryLibraryFolder->getFiles() JROOT/plugins/content/eventgallery/eventgallery.php:187 19 PlgContentEventgallery->handleEventTag() JROOT/plugins/content/eventgallery/eventgallery.php:110 18 PlgContentEventgallery->replace() JROOT/plugins/content/eventgallery/eventgallery.php:103 17 PlgContentEventgallery->onContentPrepare() JROOT/libraries/joomla/event/event.php:70 16 JEvent->update() JROOT/libraries/joomla/event/dispatcher.php:160 15 JEventDispatcher->trigger() JROOT/modules/mod_k2_content/helper.php:472 14 modK2ContentHelper::getItems() JROOT/modules/mod_k2_content/mod_k2_content.php:65 13 include JROOT/modules/mod_k2_content/mod_k2_content.php JROOT/libraries/src/Helper/ModuleHelper.php:200 12 Joomla\CMS\Helper\ModuleHelper::renderModule() Same as call in the line below. 11 call_user_func_array() JROOT/libraries/src/Cache/Controller/CallbackController.php:173 10 Joomla\CMS\Cache\Controller\CallbackController->get() JROOT/libraries/src/Helper/ModuleHelper.php:617 9 Joomla\CMS\Helper\ModuleHelper::moduleCache() JROOT/libraries/src/Document/Renderer/Html/ModuleRenderer.php:95 8 Joomla\CMS\Document\Renderer\Html\ModuleRenderer->render() JROOT/libraries/src/Document/Renderer/Html/ModulesRenderer.php:47 7 Joomla\CMS\Document\Renderer\Html\ModulesRenderer->render() JROOT/libraries/src/Document/HtmlDocument.php:511 6 Joomla\CMS\Document\HtmlDocument->getBuffer() JROOT/libraries/src/Document/HtmlDocument.php:803 5 Joomla\CMS\Document\HtmlDocument->_renderTemplate() JROOT/libraries/src/Document/HtmlDocument.php:577 4 Joomla\CMS\Document\HtmlDocument->render() JROOT/libraries/src/Application/CMSApplication.php:1112 3 Joomla\CMS\Application\CMSApplication->render() JROOT/libraries/src/Application/SiteApplication.php:778 2 Joomla\CMS\Application\SiteApplication->render() JROOT/libraries/src/Application/CMSApplication.php:231 1 Joomla\CMS\Application\CMSApplication->execute() JROOT/index.php:49 - Query Time: 0.34 ms After last query: 3.00 ms Query memory: 0.011 MB Memory before query: 28.940 MB Rows returned: 1
SELECT *
FROM w0v41_eventgallery_file
WHERE folder='DNS98'
AND file='DSC_0516.JPG'id select_type table partitions type possible_keys key key_len ref rows filtered Extra 1 SIMPLE w0v41_eventgallery_file NULL const file,index_file,index_folder file 754 const,const 1 100.00 NULL Status Duration starting 0.08 ms Executing hook on transaction 0.01 ms starting 0.01 ms checking permissions 0.01 ms Opening tables 0.03 ms init 0.01 ms System lock 0.01 ms optimizing 0.01 ms statistics 0.04 ms preparing 0.01 ms executing 0.03 ms end 0.01 ms query end 0.00 ms waiting for handler commit 0.01 ms closing tables 0.01 ms freeing items 0.05 ms cleaning up 0.01 ms # Caller File and line number 25 JDatabaseDriverMysqli->execute() JROOT/libraries/joomla/database/driver.php:1662 24 JDatabaseDriver->loadObject() JROOT/components/com_eventgallery/library/factory/file/local.php:47 23 EventgalleryLibraryFactoryFileLocal->getFileDBData() JROOT/components/com_eventgallery/library/factory/file/local.php:28 22 EventgalleryLibraryFactoryFileLocal->getFile() JROOT/components/com_eventgallery/library/factory/file.php:44 21 EventgalleryLibraryFactoryFile->getFile() JROOT/components/com_eventgallery/library/folder.php:559 20 EventgalleryLibraryFolder->getFiles() JROOT/plugins/content/eventgallery/eventgallery.php:187 19 PlgContentEventgallery->handleEventTag() JROOT/plugins/content/eventgallery/eventgallery.php:110 18 PlgContentEventgallery->replace() JROOT/plugins/content/eventgallery/eventgallery.php:103 17 PlgContentEventgallery->onContentPrepare() JROOT/libraries/joomla/event/event.php:70 16 JEvent->update() JROOT/libraries/joomla/event/dispatcher.php:160 15 JEventDispatcher->trigger() JROOT/modules/mod_k2_content/helper.php:472 14 modK2ContentHelper::getItems() JROOT/modules/mod_k2_content/mod_k2_content.php:65 13 include JROOT/modules/mod_k2_content/mod_k2_content.php JROOT/libraries/src/Helper/ModuleHelper.php:200 12 Joomla\CMS\Helper\ModuleHelper::renderModule() Same as call in the line below. 11 call_user_func_array() JROOT/libraries/src/Cache/Controller/CallbackController.php:173 10 Joomla\CMS\Cache\Controller\CallbackController->get() JROOT/libraries/src/Helper/ModuleHelper.php:617 9 Joomla\CMS\Helper\ModuleHelper::moduleCache() JROOT/libraries/src/Document/Renderer/Html/ModuleRenderer.php:95 8 Joomla\CMS\Document\Renderer\Html\ModuleRenderer->render() JROOT/libraries/src/Document/Renderer/Html/ModulesRenderer.php:47 7 Joomla\CMS\Document\Renderer\Html\ModulesRenderer->render() JROOT/libraries/src/Document/HtmlDocument.php:511 6 Joomla\CMS\Document\HtmlDocument->getBuffer() JROOT/libraries/src/Document/HtmlDocument.php:803 5 Joomla\CMS\Document\HtmlDocument->_renderTemplate() JROOT/libraries/src/Document/HtmlDocument.php:577 4 Joomla\CMS\Document\HtmlDocument->render() JROOT/libraries/src/Application/CMSApplication.php:1112 3 Joomla\CMS\Application\CMSApplication->render() JROOT/libraries/src/Application/SiteApplication.php:778 2 Joomla\CMS\Application\SiteApplication->render() JROOT/libraries/src/Application/CMSApplication.php:231 1 Joomla\CMS\Application\CMSApplication->execute() JROOT/index.php:49 - Query Time: 0.33 ms After last query: 0.79 ms Query memory: 0.011 MB Memory before query: 28.966 MB Rows returned: 1
SELECT *
FROM w0v41_eventgallery_file
WHERE folder='DNS98'
AND file='DSC_0520.JPG'id select_type table partitions type possible_keys key key_len ref rows filtered Extra 1 SIMPLE w0v41_eventgallery_file NULL const file,index_file,index_folder file 754 const,const 1 100.00 NULL Status Duration starting 0.08 ms Executing hook on transaction 0.01 ms starting 0.01 ms checking permissions 0.01 ms Opening tables 0.03 ms init 0.01 ms System lock 0.01 ms optimizing 0.01 ms statistics 0.03 ms preparing 0.01 ms executing 0.03 ms end 0.00 ms query end 0.00 ms waiting for handler commit 0.01 ms closing tables 0.01 ms freeing items 0.06 ms cleaning up 0.01 ms # Caller File and line number 25 JDatabaseDriverMysqli->execute() JROOT/libraries/joomla/database/driver.php:1662 24 JDatabaseDriver->loadObject() JROOT/components/com_eventgallery/library/factory/file/local.php:47 23 EventgalleryLibraryFactoryFileLocal->getFileDBData() JROOT/components/com_eventgallery/library/factory/file/local.php:28 22 EventgalleryLibraryFactoryFileLocal->getFile() JROOT/components/com_eventgallery/library/factory/file.php:44 21 EventgalleryLibraryFactoryFile->getFile() JROOT/components/com_eventgallery/library/folder.php:559 20 EventgalleryLibraryFolder->getFiles() JROOT/plugins/content/eventgallery/eventgallery.php:187 19 PlgContentEventgallery->handleEventTag() JROOT/plugins/content/eventgallery/eventgallery.php:110 18 PlgContentEventgallery->replace() JROOT/plugins/content/eventgallery/eventgallery.php:103 17 PlgContentEventgallery->onContentPrepare() JROOT/libraries/joomla/event/event.php:70 16 JEvent->update() JROOT/libraries/joomla/event/dispatcher.php:160 15 JEventDispatcher->trigger() JROOT/modules/mod_k2_content/helper.php:472 14 modK2ContentHelper::getItems() JROOT/modules/mod_k2_content/mod_k2_content.php:65 13 include JROOT/modules/mod_k2_content/mod_k2_content.php JROOT/libraries/src/Helper/ModuleHelper.php:200 12 Joomla\CMS\Helper\ModuleHelper::renderModule() Same as call in the line below. 11 call_user_func_array() JROOT/libraries/src/Cache/Controller/CallbackController.php:173 10 Joomla\CMS\Cache\Controller\CallbackController->get() JROOT/libraries/src/Helper/ModuleHelper.php:617 9 Joomla\CMS\Helper\ModuleHelper::moduleCache() JROOT/libraries/src/Document/Renderer/Html/ModuleRenderer.php:95 8 Joomla\CMS\Document\Renderer\Html\ModuleRenderer->render() JROOT/libraries/src/Document/Renderer/Html/ModulesRenderer.php:47 7 Joomla\CMS\Document\Renderer\Html\ModulesRenderer->render() JROOT/libraries/src/Document/HtmlDocument.php:511 6 Joomla\CMS\Document\HtmlDocument->getBuffer() JROOT/libraries/src/Document/HtmlDocument.php:803 5 Joomla\CMS\Document\HtmlDocument->_renderTemplate() JROOT/libraries/src/Document/HtmlDocument.php:577 4 Joomla\CMS\Document\HtmlDocument->render() JROOT/libraries/src/Application/CMSApplication.php:1112 3 Joomla\CMS\Application\CMSApplication->render() JROOT/libraries/src/Application/SiteApplication.php:778 2 Joomla\CMS\Application\SiteApplication->render() JROOT/libraries/src/Application/CMSApplication.php:231 1 Joomla\CMS\Application\CMSApplication->execute() JROOT/index.php:49 - Query Time: 0.32 ms After last query: 0.05 ms Query memory: 0.011 MB Memory before query: 28.982 MB Rows returned: 1
SELECT *
FROM w0v41_eventgallery_file
WHERE folder='DNS98'
AND file='DSC_0529.JPG'id select_type table partitions type possible_keys key key_len ref rows filtered Extra 1 SIMPLE w0v41_eventgallery_file NULL const file,index_file,index_folder file 754 const,const 1 100.00 NULL Status Duration starting 0.07 ms Executing hook on transaction 0.01 ms starting 0.01 ms checking permissions 0.00 ms Opening tables 0.02 ms init 0.01 ms System lock 0.01 ms optimizing 0.01 ms statistics 0.03 ms preparing 0.01 ms executing 0.03 ms end 0.01 ms query end 0.01 ms waiting for handler commit 0.01 ms closing tables 0.01 ms freeing items 0.06 ms cleaning up 0.01 ms # Caller File and line number 25 JDatabaseDriverMysqli->execute() JROOT/libraries/joomla/database/driver.php:1662 24 JDatabaseDriver->loadObject() JROOT/components/com_eventgallery/library/factory/file/local.php:47 23 EventgalleryLibraryFactoryFileLocal->getFileDBData() JROOT/components/com_eventgallery/library/factory/file/local.php:28 22 EventgalleryLibraryFactoryFileLocal->getFile() JROOT/components/com_eventgallery/library/factory/file.php:44 21 EventgalleryLibraryFactoryFile->getFile() JROOT/components/com_eventgallery/library/folder.php:559 20 EventgalleryLibraryFolder->getFiles() JROOT/plugins/content/eventgallery/eventgallery.php:187 19 PlgContentEventgallery->handleEventTag() JROOT/plugins/content/eventgallery/eventgallery.php:110 18 PlgContentEventgallery->replace() JROOT/plugins/content/eventgallery/eventgallery.php:103 17 PlgContentEventgallery->onContentPrepare() JROOT/libraries/joomla/event/event.php:70 16 JEvent->update() JROOT/libraries/joomla/event/dispatcher.php:160 15 JEventDispatcher->trigger() JROOT/modules/mod_k2_content/helper.php:472 14 modK2ContentHelper::getItems() JROOT/modules/mod_k2_content/mod_k2_content.php:65 13 include JROOT/modules/mod_k2_content/mod_k2_content.php JROOT/libraries/src/Helper/ModuleHelper.php:200 12 Joomla\CMS\Helper\ModuleHelper::renderModule() Same as call in the line below. 11 call_user_func_array() JROOT/libraries/src/Cache/Controller/CallbackController.php:173 10 Joomla\CMS\Cache\Controller\CallbackController->get() JROOT/libraries/src/Helper/ModuleHelper.php:617 9 Joomla\CMS\Helper\ModuleHelper::moduleCache() JROOT/libraries/src/Document/Renderer/Html/ModuleRenderer.php:95 8 Joomla\CMS\Document\Renderer\Html\ModuleRenderer->render() JROOT/libraries/src/Document/Renderer/Html/ModulesRenderer.php:47 7 Joomla\CMS\Document\Renderer\Html\ModulesRenderer->render() JROOT/libraries/src/Document/HtmlDocument.php:511 6 Joomla\CMS\Document\HtmlDocument->getBuffer() JROOT/libraries/src/Document/HtmlDocument.php:803 5 Joomla\CMS\Document\HtmlDocument->_renderTemplate() JROOT/libraries/src/Document/HtmlDocument.php:577 4 Joomla\CMS\Document\HtmlDocument->render() JROOT/libraries/src/Application/CMSApplication.php:1112 3 Joomla\CMS\Application\CMSApplication->render() JROOT/libraries/src/Application/SiteApplication.php:778 2 Joomla\CMS\Application\SiteApplication->render() JROOT/libraries/src/Application/CMSApplication.php:231 1 Joomla\CMS\Application\CMSApplication->execute() JROOT/index.php:49 - Query Time: 0.31 ms After last query: 0.05 ms Query memory: 0.011 MB Memory before query: 28.998 MB Rows returned: 1
SELECT *
FROM w0v41_eventgallery_file
WHERE folder='DNS98'
AND file='DSC_0530.JPG'id select_type table partitions type possible_keys key key_len ref rows filtered Extra 1 SIMPLE w0v41_eventgallery_file NULL const file,index_file,index_folder file 754 const,const 1 100.00 NULL Status Duration starting 0.06 ms Executing hook on transaction 0.01 ms starting 0.01 ms checking permissions 0.00 ms Opening tables 0.03 ms init 0.01 ms System lock 0.01 ms optimizing 0.01 ms statistics 0.03 ms preparing 0.01 ms executing 0.03 ms end 0.01 ms query end 0.00 ms waiting for handler commit 0.01 ms closing tables 0.01 ms freeing items 0.05 ms cleaning up 0.01 ms # Caller File and line number 25 JDatabaseDriverMysqli->execute() JROOT/libraries/joomla/database/driver.php:1662 24 JDatabaseDriver->loadObject() JROOT/components/com_eventgallery/library/factory/file/local.php:47 23 EventgalleryLibraryFactoryFileLocal->getFileDBData() JROOT/components/com_eventgallery/library/factory/file/local.php:28 22 EventgalleryLibraryFactoryFileLocal->getFile() JROOT/components/com_eventgallery/library/factory/file.php:44 21 EventgalleryLibraryFactoryFile->getFile() JROOT/components/com_eventgallery/library/folder.php:559 20 EventgalleryLibraryFolder->getFiles() JROOT/plugins/content/eventgallery/eventgallery.php:187 19 PlgContentEventgallery->handleEventTag() JROOT/plugins/content/eventgallery/eventgallery.php:110 18 PlgContentEventgallery->replace() JROOT/plugins/content/eventgallery/eventgallery.php:103 17 PlgContentEventgallery->onContentPrepare() JROOT/libraries/joomla/event/event.php:70 16 JEvent->update() JROOT/libraries/joomla/event/dispatcher.php:160 15 JEventDispatcher->trigger() JROOT/modules/mod_k2_content/helper.php:472 14 modK2ContentHelper::getItems() JROOT/modules/mod_k2_content/mod_k2_content.php:65 13 include JROOT/modules/mod_k2_content/mod_k2_content.php JROOT/libraries/src/Helper/ModuleHelper.php:200 12 Joomla\CMS\Helper\ModuleHelper::renderModule() Same as call in the line below. 11 call_user_func_array() JROOT/libraries/src/Cache/Controller/CallbackController.php:173 10 Joomla\CMS\Cache\Controller\CallbackController->get() JROOT/libraries/src/Helper/ModuleHelper.php:617 9 Joomla\CMS\Helper\ModuleHelper::moduleCache() JROOT/libraries/src/Document/Renderer/Html/ModuleRenderer.php:95 8 Joomla\CMS\Document\Renderer\Html\ModuleRenderer->render() JROOT/libraries/src/Document/Renderer/Html/ModulesRenderer.php:47 7 Joomla\CMS\Document\Renderer\Html\ModulesRenderer->render() JROOT/libraries/src/Document/HtmlDocument.php:511 6 Joomla\CMS\Document\HtmlDocument->getBuffer() JROOT/libraries/src/Document/HtmlDocument.php:803 5 Joomla\CMS\Document\HtmlDocument->_renderTemplate() JROOT/libraries/src/Document/HtmlDocument.php:577 4 Joomla\CMS\Document\HtmlDocument->render() JROOT/libraries/src/Application/CMSApplication.php:1112 3 Joomla\CMS\Application\CMSApplication->render() JROOT/libraries/src/Application/SiteApplication.php:778 2 Joomla\CMS\Application\SiteApplication->render() JROOT/libraries/src/Application/CMSApplication.php:231 1 Joomla\CMS\Application\CMSApplication->execute() JROOT/index.php:49 - Query Time: 0.31 ms After last query: 0.05 ms Query memory: 0.011 MB Memory before query: 29.015 MB Rows returned: 1
SELECT *
FROM w0v41_eventgallery_file
WHERE folder='DNS98'
AND file='DSC_0533.JPG'id select_type table partitions type possible_keys key key_len ref rows filtered Extra 1 SIMPLE w0v41_eventgallery_file NULL const file,index_file,index_folder file 754 const,const 1 100.00 NULL Status Duration starting 0.06 ms Executing hook on transaction 0.01 ms starting 0.01 ms checking permissions 0.01 ms Opening tables 0.03 ms init 0.01 ms System lock 0.01 ms optimizing 0.01 ms statistics 0.03 ms preparing 0.01 ms executing 0.03 ms end 0.01 ms query end 0.00 ms waiting for handler commit 0.01 ms closing tables 0.01 ms freeing items 0.06 ms cleaning up 0.01 ms # Caller File and line number 25 JDatabaseDriverMysqli->execute() JROOT/libraries/joomla/database/driver.php:1662 24 JDatabaseDriver->loadObject() JROOT/components/com_eventgallery/library/factory/file/local.php:47 23 EventgalleryLibraryFactoryFileLocal->getFileDBData() JROOT/components/com_eventgallery/library/factory/file/local.php:28 22 EventgalleryLibraryFactoryFileLocal->getFile() JROOT/components/com_eventgallery/library/factory/file.php:44 21 EventgalleryLibraryFactoryFile->getFile() JROOT/components/com_eventgallery/library/folder.php:559 20 EventgalleryLibraryFolder->getFiles() JROOT/plugins/content/eventgallery/eventgallery.php:187 19 PlgContentEventgallery->handleEventTag() JROOT/plugins/content/eventgallery/eventgallery.php:110 18 PlgContentEventgallery->replace() JROOT/plugins/content/eventgallery/eventgallery.php:103 17 PlgContentEventgallery->onContentPrepare() JROOT/libraries/joomla/event/event.php:70 16 JEvent->update() JROOT/libraries/joomla/event/dispatcher.php:160 15 JEventDispatcher->trigger() JROOT/modules/mod_k2_content/helper.php:472 14 modK2ContentHelper::getItems() JROOT/modules/mod_k2_content/mod_k2_content.php:65 13 include JROOT/modules/mod_k2_content/mod_k2_content.php JROOT/libraries/src/Helper/ModuleHelper.php:200 12 Joomla\CMS\Helper\ModuleHelper::renderModule() Same as call in the line below. 11 call_user_func_array() JROOT/libraries/src/Cache/Controller/CallbackController.php:173 10 Joomla\CMS\Cache\Controller\CallbackController->get() JROOT/libraries/src/Helper/ModuleHelper.php:617 9 Joomla\CMS\Helper\ModuleHelper::moduleCache() JROOT/libraries/src/Document/Renderer/Html/ModuleRenderer.php:95 8 Joomla\CMS\Document\Renderer\Html\ModuleRenderer->render() JROOT/libraries/src/Document/Renderer/Html/ModulesRenderer.php:47 7 Joomla\CMS\Document\Renderer\Html\ModulesRenderer->render() JROOT/libraries/src/Document/HtmlDocument.php:511 6 Joomla\CMS\Document\HtmlDocument->getBuffer() JROOT/libraries/src/Document/HtmlDocument.php:803 5 Joomla\CMS\Document\HtmlDocument->_renderTemplate() JROOT/libraries/src/Document/HtmlDocument.php:577 4 Joomla\CMS\Document\HtmlDocument->render() JROOT/libraries/src/Application/CMSApplication.php:1112 3 Joomla\CMS\Application\CMSApplication->render() JROOT/libraries/src/Application/SiteApplication.php:778 2 Joomla\CMS\Application\SiteApplication->render() JROOT/libraries/src/Application/CMSApplication.php:231 1 Joomla\CMS\Application\CMSApplication->execute() JROOT/index.php:49 - Query Time: 0.31 ms After last query: 0.08 ms Query memory: 0.015 MB Memory before query: 29.043 MB Rows returned: 1
SELECT *
FROM w0v41_eventgallery_file
WHERE folder='DNS98'
AND file='DSC_0538.JPG'id select_type table partitions type possible_keys key key_len ref rows filtered Extra 1 SIMPLE w0v41_eventgallery_file NULL const file,index_file,index_folder file 754 const,const 1 100.00 NULL Status Duration starting 0.07 ms Executing hook on transaction 0.01 ms starting 0.01 ms checking permissions 0.01 ms Opening tables 0.03 ms init 0.01 ms System lock 0.01 ms optimizing 0.01 ms statistics 0.03 ms preparing 0.01 ms executing 0.03 ms end 0.01 ms query end 0.00 ms waiting for handler commit 0.01 ms closing tables 0.01 ms freeing items 0.05 ms cleaning up 0.01 ms # Caller File and line number 25 JDatabaseDriverMysqli->execute() JROOT/libraries/joomla/database/driver.php:1662 24 JDatabaseDriver->loadObject() JROOT/components/com_eventgallery/library/factory/file/local.php:47 23 EventgalleryLibraryFactoryFileLocal->getFileDBData() JROOT/components/com_eventgallery/library/factory/file/local.php:28 22 EventgalleryLibraryFactoryFileLocal->getFile() JROOT/components/com_eventgallery/library/factory/file.php:44 21 EventgalleryLibraryFactoryFile->getFile() JROOT/components/com_eventgallery/library/folder.php:559 20 EventgalleryLibraryFolder->getFiles() JROOT/plugins/content/eventgallery/eventgallery.php:187 19 PlgContentEventgallery->handleEventTag() JROOT/plugins/content/eventgallery/eventgallery.php:110 18 PlgContentEventgallery->replace() JROOT/plugins/content/eventgallery/eventgallery.php:103 17 PlgContentEventgallery->onContentPrepare() JROOT/libraries/joomla/event/event.php:70 16 JEvent->update() JROOT/libraries/joomla/event/dispatcher.php:160 15 JEventDispatcher->trigger() JROOT/modules/mod_k2_content/helper.php:472 14 modK2ContentHelper::getItems() JROOT/modules/mod_k2_content/mod_k2_content.php:65 13 include JROOT/modules/mod_k2_content/mod_k2_content.php JROOT/libraries/src/Helper/ModuleHelper.php:200 12 Joomla\CMS\Helper\ModuleHelper::renderModule() Same as call in the line below. 11 call_user_func_array() JROOT/libraries/src/Cache/Controller/CallbackController.php:173 10 Joomla\CMS\Cache\Controller\CallbackController->get() JROOT/libraries/src/Helper/ModuleHelper.php:617 9 Joomla\CMS\Helper\ModuleHelper::moduleCache() JROOT/libraries/src/Document/Renderer/Html/ModuleRenderer.php:95 8 Joomla\CMS\Document\Renderer\Html\ModuleRenderer->render() JROOT/libraries/src/Document/Renderer/Html/ModulesRenderer.php:47 7 Joomla\CMS\Document\Renderer\Html\ModulesRenderer->render() JROOT/libraries/src/Document/HtmlDocument.php:511 6 Joomla\CMS\Document\HtmlDocument->getBuffer() JROOT/libraries/src/Document/HtmlDocument.php:803 5 Joomla\CMS\Document\HtmlDocument->_renderTemplate() JROOT/libraries/src/Document/HtmlDocument.php:577 4 Joomla\CMS\Document\HtmlDocument->render() JROOT/libraries/src/Application/CMSApplication.php:1112 3 Joomla\CMS\Application\CMSApplication->render() JROOT/libraries/src/Application/SiteApplication.php:778 2 Joomla\CMS\Application\SiteApplication->render() JROOT/libraries/src/Application/CMSApplication.php:231 1 Joomla\CMS\Application\CMSApplication->execute() JROOT/index.php:49 - Query Time: 0.30 ms After last query: 0.05 ms Query memory: 0.011 MB Memory before query: 29.063 MB Rows returned: 1
SELECT *
FROM w0v41_eventgallery_file
WHERE folder='DNS98'
AND file='DSC_0548.JPG'id select_type table partitions type possible_keys key key_len ref rows filtered Extra 1 SIMPLE w0v41_eventgallery_file NULL const file,index_file,index_folder file 754 const,const 1 100.00 NULL Status Duration starting 0.06 ms Executing hook on transaction 0.00 ms starting 0.01 ms checking permissions 0.01 ms Opening tables 0.02 ms init 0.01 ms System lock 0.01 ms optimizing 0.01 ms statistics 0.03 ms preparing 0.01 ms executing 0.03 ms end 0.00 ms query end 0.00 ms waiting for handler commit 0.01 ms closing tables 0.01 ms freeing items 0.05 ms cleaning up 0.01 ms # Caller File and line number 25 JDatabaseDriverMysqli->execute() JROOT/libraries/joomla/database/driver.php:1662 24 JDatabaseDriver->loadObject() JROOT/components/com_eventgallery/library/factory/file/local.php:47 23 EventgalleryLibraryFactoryFileLocal->getFileDBData() JROOT/components/com_eventgallery/library/factory/file/local.php:28 22 EventgalleryLibraryFactoryFileLocal->getFile() JROOT/components/com_eventgallery/library/factory/file.php:44 21 EventgalleryLibraryFactoryFile->getFile() JROOT/components/com_eventgallery/library/folder.php:559 20 EventgalleryLibraryFolder->getFiles() JROOT/plugins/content/eventgallery/eventgallery.php:187 19 PlgContentEventgallery->handleEventTag() JROOT/plugins/content/eventgallery/eventgallery.php:110 18 PlgContentEventgallery->replace() JROOT/plugins/content/eventgallery/eventgallery.php:103 17 PlgContentEventgallery->onContentPrepare() JROOT/libraries/joomla/event/event.php:70 16 JEvent->update() JROOT/libraries/joomla/event/dispatcher.php:160 15 JEventDispatcher->trigger() JROOT/modules/mod_k2_content/helper.php:472 14 modK2ContentHelper::getItems() JROOT/modules/mod_k2_content/mod_k2_content.php:65 13 include JROOT/modules/mod_k2_content/mod_k2_content.php JROOT/libraries/src/Helper/ModuleHelper.php:200 12 Joomla\CMS\Helper\ModuleHelper::renderModule() Same as call in the line below. 11 call_user_func_array() JROOT/libraries/src/Cache/Controller/CallbackController.php:173 10 Joomla\CMS\Cache\Controller\CallbackController->get() JROOT/libraries/src/Helper/ModuleHelper.php:617 9 Joomla\CMS\Helper\ModuleHelper::moduleCache() JROOT/libraries/src/Document/Renderer/Html/ModuleRenderer.php:95 8 Joomla\CMS\Document\Renderer\Html\ModuleRenderer->render() JROOT/libraries/src/Document/Renderer/Html/ModulesRenderer.php:47 7 Joomla\CMS\Document\Renderer\Html\ModulesRenderer->render() JROOT/libraries/src/Document/HtmlDocument.php:511 6 Joomla\CMS\Document\HtmlDocument->getBuffer() JROOT/libraries/src/Document/HtmlDocument.php:803 5 Joomla\CMS\Document\HtmlDocument->_renderTemplate() JROOT/libraries/src/Document/HtmlDocument.php:577 4 Joomla\CMS\Document\HtmlDocument->render() JROOT/libraries/src/Application/CMSApplication.php:1112 3 Joomla\CMS\Application\CMSApplication->render() JROOT/libraries/src/Application/SiteApplication.php:778 2 Joomla\CMS\Application\SiteApplication->render() JROOT/libraries/src/Application/CMSApplication.php:231 1 Joomla\CMS\Application\CMSApplication->execute() JROOT/index.php:49 - Query Time: 0.33 ms After last query: 0.08 ms Query memory: 0.011 MB Memory before query: 29.080 MB Rows returned: 1
SELECT *
FROM w0v41_eventgallery_file
WHERE folder='DNS98'
AND file='DSC_0565.JPG'id select_type table partitions type possible_keys key key_len ref rows filtered Extra 1 SIMPLE w0v41_eventgallery_file NULL const file,index_file,index_folder file 754 const,const 1 100.00 NULL Status Duration starting 0.06 ms Executing hook on transaction 0.01 ms starting 0.01 ms checking permissions 0.01 ms Opening tables 0.03 ms init 0.01 ms System lock 0.01 ms optimizing 0.01 ms statistics 0.05 ms preparing 0.01 ms executing 0.03 ms end 0.01 ms query end 0.00 ms waiting for handler commit 0.01 ms closing tables 0.01 ms freeing items 0.05 ms cleaning up 0.01 ms # Caller File and line number 25 JDatabaseDriverMysqli->execute() JROOT/libraries/joomla/database/driver.php:1662 24 JDatabaseDriver->loadObject() JROOT/components/com_eventgallery/library/factory/file/local.php:47 23 EventgalleryLibraryFactoryFileLocal->getFileDBData() JROOT/components/com_eventgallery/library/factory/file/local.php:28 22 EventgalleryLibraryFactoryFileLocal->getFile() JROOT/components/com_eventgallery/library/factory/file.php:44 21 EventgalleryLibraryFactoryFile->getFile() JROOT/components/com_eventgallery/library/folder.php:559 20 EventgalleryLibraryFolder->getFiles() JROOT/plugins/content/eventgallery/eventgallery.php:187 19 PlgContentEventgallery->handleEventTag() JROOT/plugins/content/eventgallery/eventgallery.php:110 18 PlgContentEventgallery->replace() JROOT/plugins/content/eventgallery/eventgallery.php:103 17 PlgContentEventgallery->onContentPrepare() JROOT/libraries/joomla/event/event.php:70 16 JEvent->update() JROOT/libraries/joomla/event/dispatcher.php:160 15 JEventDispatcher->trigger() JROOT/modules/mod_k2_content/helper.php:472 14 modK2ContentHelper::getItems() JROOT/modules/mod_k2_content/mod_k2_content.php:65 13 include JROOT/modules/mod_k2_content/mod_k2_content.php JROOT/libraries/src/Helper/ModuleHelper.php:200 12 Joomla\CMS\Helper\ModuleHelper::renderModule() Same as call in the line below. 11 call_user_func_array() JROOT/libraries/src/Cache/Controller/CallbackController.php:173 10 Joomla\CMS\Cache\Controller\CallbackController->get() JROOT/libraries/src/Helper/ModuleHelper.php:617 9 Joomla\CMS\Helper\ModuleHelper::moduleCache() JROOT/libraries/src/Document/Renderer/Html/ModuleRenderer.php:95 8 Joomla\CMS\Document\Renderer\Html\ModuleRenderer->render() JROOT/libraries/src/Document/Renderer/Html/ModulesRenderer.php:47 7 Joomla\CMS\Document\Renderer\Html\ModulesRenderer->render() JROOT/libraries/src/Document/HtmlDocument.php:511 6 Joomla\CMS\Document\HtmlDocument->getBuffer() JROOT/libraries/src/Document/HtmlDocument.php:803 5 Joomla\CMS\Document\HtmlDocument->_renderTemplate() JROOT/libraries/src/Document/HtmlDocument.php:577 4 Joomla\CMS\Document\HtmlDocument->render() JROOT/libraries/src/Application/CMSApplication.php:1112 3 Joomla\CMS\Application\CMSApplication->render() JROOT/libraries/src/Application/SiteApplication.php:778 2 Joomla\CMS\Application\SiteApplication->render() JROOT/libraries/src/Application/CMSApplication.php:231 1 Joomla\CMS\Application\CMSApplication->execute() JROOT/index.php:49 - Query Time: 0.30 ms After last query: 0.07 ms Query memory: 0.011 MB Memory before query: 29.096 MB Rows returned: 1
SELECT *
FROM w0v41_eventgallery_file
WHERE folder='DNS98'
AND file='DSC_0575.JPG'id select_type table partitions type possible_keys key key_len ref rows filtered Extra 1 SIMPLE w0v41_eventgallery_file NULL const file,index_file,index_folder file 754 const,const 1 100.00 NULL Status Duration starting 0.06 ms Executing hook on transaction 0.01 ms starting 0.01 ms checking permissions 0.01 ms Opening tables 0.03 ms init 0.01 ms System lock 0.01 ms optimizing 0.01 ms statistics 0.03 ms preparing 0.01 ms executing 0.03 ms end 0.01 ms query end 0.00 ms waiting for handler commit 0.01 ms closing tables 0.01 ms freeing items 0.06 ms cleaning up 0.01 ms # Caller File and line number 25 JDatabaseDriverMysqli->execute() JROOT/libraries/joomla/database/driver.php:1662 24 JDatabaseDriver->loadObject() JROOT/components/com_eventgallery/library/factory/file/local.php:47 23 EventgalleryLibraryFactoryFileLocal->getFileDBData() JROOT/components/com_eventgallery/library/factory/file/local.php:28 22 EventgalleryLibraryFactoryFileLocal->getFile() JROOT/components/com_eventgallery/library/factory/file.php:44 21 EventgalleryLibraryFactoryFile->getFile() JROOT/components/com_eventgallery/library/folder.php:559 20 EventgalleryLibraryFolder->getFiles() JROOT/plugins/content/eventgallery/eventgallery.php:187 19 PlgContentEventgallery->handleEventTag() JROOT/plugins/content/eventgallery/eventgallery.php:110 18 PlgContentEventgallery->replace() JROOT/plugins/content/eventgallery/eventgallery.php:103 17 PlgContentEventgallery->onContentPrepare() JROOT/libraries/joomla/event/event.php:70 16 JEvent->update() JROOT/libraries/joomla/event/dispatcher.php:160 15 JEventDispatcher->trigger() JROOT/modules/mod_k2_content/helper.php:472 14 modK2ContentHelper::getItems() JROOT/modules/mod_k2_content/mod_k2_content.php:65 13 include JROOT/modules/mod_k2_content/mod_k2_content.php JROOT/libraries/src/Helper/ModuleHelper.php:200 12 Joomla\CMS\Helper\ModuleHelper::renderModule() Same as call in the line below. 11 call_user_func_array() JROOT/libraries/src/Cache/Controller/CallbackController.php:173 10 Joomla\CMS\Cache\Controller\CallbackController->get() JROOT/libraries/src/Helper/ModuleHelper.php:617 9 Joomla\CMS\Helper\ModuleHelper::moduleCache() JROOT/libraries/src/Document/Renderer/Html/ModuleRenderer.php:95 8 Joomla\CMS\Document\Renderer\Html\ModuleRenderer->render() JROOT/libraries/src/Document/Renderer/Html/ModulesRenderer.php:47 7 Joomla\CMS\Document\Renderer\Html\ModulesRenderer->render() JROOT/libraries/src/Document/HtmlDocument.php:511 6 Joomla\CMS\Document\HtmlDocument->getBuffer() JROOT/libraries/src/Document/HtmlDocument.php:803 5 Joomla\CMS\Document\HtmlDocument->_renderTemplate() JROOT/libraries/src/Document/HtmlDocument.php:577 4 Joomla\CMS\Document\HtmlDocument->render() JROOT/libraries/src/Application/CMSApplication.php:1112 3 Joomla\CMS\Application\CMSApplication->render() JROOT/libraries/src/Application/SiteApplication.php:778 2 Joomla\CMS\Application\SiteApplication->render() JROOT/libraries/src/Application/CMSApplication.php:231 1 Joomla\CMS\Application\CMSApplication->execute() JROOT/index.php:49 - Query Time: 0.30 ms After last query: 0.07 ms Query memory: 0.011 MB Memory before query: 29.113 MB Rows returned: 1
SELECT *
FROM w0v41_eventgallery_file
WHERE folder='DNS98'
AND file='DSC_0594.JPG'id select_type table partitions type possible_keys key key_len ref rows filtered Extra 1 SIMPLE w0v41_eventgallery_file NULL const file,index_file,index_folder file 754 const,const 1 100.00 NULL Status Duration starting 0.06 ms Executing hook on transaction 0.01 ms starting 0.01 ms checking permissions 0.01 ms Opening tables 0.03 ms init 0.01 ms System lock 0.01 ms optimizing 0.01 ms statistics 0.03 ms preparing 0.01 ms executing 0.03 ms end 0.01 ms query end 0.00 ms waiting for handler commit 0.01 ms closing tables 0.01 ms freeing items 0.05 ms cleaning up 0.01 ms # Caller File and line number 25 JDatabaseDriverMysqli->execute() JROOT/libraries/joomla/database/driver.php:1662 24 JDatabaseDriver->loadObject() JROOT/components/com_eventgallery/library/factory/file/local.php:47 23 EventgalleryLibraryFactoryFileLocal->getFileDBData() JROOT/components/com_eventgallery/library/factory/file/local.php:28 22 EventgalleryLibraryFactoryFileLocal->getFile() JROOT/components/com_eventgallery/library/factory/file.php:44 21 EventgalleryLibraryFactoryFile->getFile() JROOT/components/com_eventgallery/library/folder.php:559 20 EventgalleryLibraryFolder->getFiles() JROOT/plugins/content/eventgallery/eventgallery.php:187 19 PlgContentEventgallery->handleEventTag() JROOT/plugins/content/eventgallery/eventgallery.php:110 18 PlgContentEventgallery->replace() JROOT/plugins/content/eventgallery/eventgallery.php:103 17 PlgContentEventgallery->onContentPrepare() JROOT/libraries/joomla/event/event.php:70 16 JEvent->update() JROOT/libraries/joomla/event/dispatcher.php:160 15 JEventDispatcher->trigger() JROOT/modules/mod_k2_content/helper.php:472 14 modK2ContentHelper::getItems() JROOT/modules/mod_k2_content/mod_k2_content.php:65 13 include JROOT/modules/mod_k2_content/mod_k2_content.php JROOT/libraries/src/Helper/ModuleHelper.php:200 12 Joomla\CMS\Helper\ModuleHelper::renderModule() Same as call in the line below. 11 call_user_func_array() JROOT/libraries/src/Cache/Controller/CallbackController.php:173 10 Joomla\CMS\Cache\Controller\CallbackController->get() JROOT/libraries/src/Helper/ModuleHelper.php:617 9 Joomla\CMS\Helper\ModuleHelper::moduleCache() JROOT/libraries/src/Document/Renderer/Html/ModuleRenderer.php:95 8 Joomla\CMS\Document\Renderer\Html\ModuleRenderer->render() JROOT/libraries/src/Document/Renderer/Html/ModulesRenderer.php:47 7 Joomla\CMS\Document\Renderer\Html\ModulesRenderer->render() JROOT/libraries/src/Document/HtmlDocument.php:511 6 Joomla\CMS\Document\HtmlDocument->getBuffer() JROOT/libraries/src/Document/HtmlDocument.php:803 5 Joomla\CMS\Document\HtmlDocument->_renderTemplate() JROOT/libraries/src/Document/HtmlDocument.php:577 4 Joomla\CMS\Document\HtmlDocument->render() JROOT/libraries/src/Application/CMSApplication.php:1112 3 Joomla\CMS\Application\CMSApplication->render() JROOT/libraries/src/Application/SiteApplication.php:778 2 Joomla\CMS\Application\SiteApplication->render() JROOT/libraries/src/Application/CMSApplication.php:231 1 Joomla\CMS\Application\CMSApplication->execute() JROOT/index.php:49 - Query Time: 4.06 ms After last query: 0.05 ms Query memory: 0.011 MB Memory before query: 29.129 MB Rows returned: 1
SELECT *
FROM w0v41_eventgallery_file
WHERE folder='DNS98'
AND file='DSC_0597.JPG'id select_type table partitions type possible_keys key key_len ref rows filtered Extra 1 SIMPLE w0v41_eventgallery_file NULL const file,index_file,index_folder file 754 const,const 1 100.00 NULL Status Duration starting 0.06 ms Executing hook on transaction 0.01 ms starting 0.01 ms checking permissions 0.01 ms Opening tables 0.02 ms init 0.01 ms System lock 0.01 ms optimizing 0.01 ms statistics 0.03 ms preparing 0.01 ms executing 0.03 ms end 0.01 ms query end 0.00 ms waiting for handler commit 0.01 ms closing tables 0.01 ms freeing items 0.05 ms cleaning up 0.01 ms # Caller File and line number 25 JDatabaseDriverMysqli->execute() JROOT/libraries/joomla/database/driver.php:1662 24 JDatabaseDriver->loadObject() JROOT/components/com_eventgallery/library/factory/file/local.php:47 23 EventgalleryLibraryFactoryFileLocal->getFileDBData() JROOT/components/com_eventgallery/library/factory/file/local.php:28 22 EventgalleryLibraryFactoryFileLocal->getFile() JROOT/components/com_eventgallery/library/factory/file.php:44 21 EventgalleryLibraryFactoryFile->getFile() JROOT/components/com_eventgallery/library/folder.php:559 20 EventgalleryLibraryFolder->getFiles() JROOT/plugins/content/eventgallery/eventgallery.php:187 19 PlgContentEventgallery->handleEventTag() JROOT/plugins/content/eventgallery/eventgallery.php:110 18 PlgContentEventgallery->replace() JROOT/plugins/content/eventgallery/eventgallery.php:103 17 PlgContentEventgallery->onContentPrepare() JROOT/libraries/joomla/event/event.php:70 16 JEvent->update() JROOT/libraries/joomla/event/dispatcher.php:160 15 JEventDispatcher->trigger() JROOT/modules/mod_k2_content/helper.php:472 14 modK2ContentHelper::getItems() JROOT/modules/mod_k2_content/mod_k2_content.php:65 13 include JROOT/modules/mod_k2_content/mod_k2_content.php JROOT/libraries/src/Helper/ModuleHelper.php:200 12 Joomla\CMS\Helper\ModuleHelper::renderModule() Same as call in the line below. 11 call_user_func_array() JROOT/libraries/src/Cache/Controller/CallbackController.php:173 10 Joomla\CMS\Cache\Controller\CallbackController->get() JROOT/libraries/src/Helper/ModuleHelper.php:617 9 Joomla\CMS\Helper\ModuleHelper::moduleCache() JROOT/libraries/src/Document/Renderer/Html/ModuleRenderer.php:95 8 Joomla\CMS\Document\Renderer\Html\ModuleRenderer->render() JROOT/libraries/src/Document/Renderer/Html/ModulesRenderer.php:47 7 Joomla\CMS\Document\Renderer\Html\ModulesRenderer->render() JROOT/libraries/src/Document/HtmlDocument.php:511 6 Joomla\CMS\Document\HtmlDocument->getBuffer() JROOT/libraries/src/Document/HtmlDocument.php:803 5 Joomla\CMS\Document\HtmlDocument->_renderTemplate() JROOT/libraries/src/Document/HtmlDocument.php:577 4 Joomla\CMS\Document\HtmlDocument->render() JROOT/libraries/src/Application/CMSApplication.php:1112 3 Joomla\CMS\Application\CMSApplication->render() JROOT/libraries/src/Application/SiteApplication.php:778 2 Joomla\CMS\Application\SiteApplication->render() JROOT/libraries/src/Application/CMSApplication.php:231 1 Joomla\CMS\Application\CMSApplication->execute() JROOT/index.php:49 - Query Time: 0.34 ms After last query: 0.09 ms Query memory: 0.011 MB Memory before query: 29.146 MB Rows returned: 1
SELECT *
FROM w0v41_eventgallery_file
WHERE folder='DNS98'
AND file='DSC_0614.JPG'id select_type table partitions type possible_keys key key_len ref rows filtered Extra 1 SIMPLE w0v41_eventgallery_file NULL const file,index_file,index_folder file 754 const,const 1 100.00 NULL Status Duration starting 0.08 ms Executing hook on transaction 0.01 ms starting 0.01 ms checking permissions 0.00 ms Opening tables 0.03 ms init 0.01 ms System lock 0.01 ms optimizing 0.01 ms statistics 0.03 ms preparing 0.01 ms executing 0.03 ms end 0.01 ms query end 0.00 ms waiting for handler commit 0.01 ms closing tables 0.01 ms freeing items 0.05 ms cleaning up 0.01 ms # Caller File and line number 25 JDatabaseDriverMysqli->execute() JROOT/libraries/joomla/database/driver.php:1662 24 JDatabaseDriver->loadObject() JROOT/components/com_eventgallery/library/factory/file/local.php:47 23 EventgalleryLibraryFactoryFileLocal->getFileDBData() JROOT/components/com_eventgallery/library/factory/file/local.php:28 22 EventgalleryLibraryFactoryFileLocal->getFile() JROOT/components/com_eventgallery/library/factory/file.php:44 21 EventgalleryLibraryFactoryFile->getFile() JROOT/components/com_eventgallery/library/folder.php:559 20 EventgalleryLibraryFolder->getFiles() JROOT/plugins/content/eventgallery/eventgallery.php:187 19 PlgContentEventgallery->handleEventTag() JROOT/plugins/content/eventgallery/eventgallery.php:110 18 PlgContentEventgallery->replace() JROOT/plugins/content/eventgallery/eventgallery.php:103 17 PlgContentEventgallery->onContentPrepare() JROOT/libraries/joomla/event/event.php:70 16 JEvent->update() JROOT/libraries/joomla/event/dispatcher.php:160 15 JEventDispatcher->trigger() JROOT/modules/mod_k2_content/helper.php:472 14 modK2ContentHelper::getItems() JROOT/modules/mod_k2_content/mod_k2_content.php:65 13 include JROOT/modules/mod_k2_content/mod_k2_content.php JROOT/libraries/src/Helper/ModuleHelper.php:200 12 Joomla\CMS\Helper\ModuleHelper::renderModule() Same as call in the line below. 11 call_user_func_array() JROOT/libraries/src/Cache/Controller/CallbackController.php:173 10 Joomla\CMS\Cache\Controller\CallbackController->get() JROOT/libraries/src/Helper/ModuleHelper.php:617 9 Joomla\CMS\Helper\ModuleHelper::moduleCache() JROOT/libraries/src/Document/Renderer/Html/ModuleRenderer.php:95 8 Joomla\CMS\Document\Renderer\Html\ModuleRenderer->render() JROOT/libraries/src/Document/Renderer/Html/ModulesRenderer.php:47 7 Joomla\CMS\Document\Renderer\Html\ModulesRenderer->render() JROOT/libraries/src/Document/HtmlDocument.php:511 6 Joomla\CMS\Document\HtmlDocument->getBuffer() JROOT/libraries/src/Document/HtmlDocument.php:803 5 Joomla\CMS\Document\HtmlDocument->_renderTemplate() JROOT/libraries/src/Document/HtmlDocument.php:577 4 Joomla\CMS\Document\HtmlDocument->render() JROOT/libraries/src/Application/CMSApplication.php:1112 3 Joomla\CMS\Application\CMSApplication->render() JROOT/libraries/src/Application/SiteApplication.php:778 2 Joomla\CMS\Application\SiteApplication->render() JROOT/libraries/src/Application/CMSApplication.php:231 1 Joomla\CMS\Application\CMSApplication->execute() JROOT/index.php:49 - Query Time: 0.33 ms After last query: 0.09 ms Query memory: 0.011 MB Memory before query: 29.162 MB Rows returned: 1
SELECT *
FROM w0v41_eventgallery_file
WHERE folder='DNS98'
AND file='DSC_0621.JPG'id select_type table partitions type possible_keys key key_len ref rows filtered Extra 1 SIMPLE w0v41_eventgallery_file NULL const file,index_file,index_folder file 754 const,const 1 100.00 NULL Status Duration starting 0.07 ms Executing hook on transaction 0.01 ms starting 0.01 ms checking permissions 0.01 ms Opening tables 0.03 ms init 0.01 ms System lock 0.01 ms optimizing 0.01 ms statistics 0.03 ms preparing 0.01 ms executing 0.03 ms end 0.01 ms query end 0.00 ms waiting for handler commit 0.01 ms closing tables 0.01 ms freeing items 0.06 ms cleaning up 0.01 ms # Caller File and line number 25 JDatabaseDriverMysqli->execute() JROOT/libraries/joomla/database/driver.php:1662 24 JDatabaseDriver->loadObject() JROOT/components/com_eventgallery/library/factory/file/local.php:47 23 EventgalleryLibraryFactoryFileLocal->getFileDBData() JROOT/components/com_eventgallery/library/factory/file/local.php:28 22 EventgalleryLibraryFactoryFileLocal->getFile() JROOT/components/com_eventgallery/library/factory/file.php:44 21 EventgalleryLibraryFactoryFile->getFile() JROOT/components/com_eventgallery/library/folder.php:559 20 EventgalleryLibraryFolder->getFiles() JROOT/plugins/content/eventgallery/eventgallery.php:187 19 PlgContentEventgallery->handleEventTag() JROOT/plugins/content/eventgallery/eventgallery.php:110 18 PlgContentEventgallery->replace() JROOT/plugins/content/eventgallery/eventgallery.php:103 17 PlgContentEventgallery->onContentPrepare() JROOT/libraries/joomla/event/event.php:70 16 JEvent->update() JROOT/libraries/joomla/event/dispatcher.php:160 15 JEventDispatcher->trigger() JROOT/modules/mod_k2_content/helper.php:472 14 modK2ContentHelper::getItems() JROOT/modules/mod_k2_content/mod_k2_content.php:65 13 include JROOT/modules/mod_k2_content/mod_k2_content.php JROOT/libraries/src/Helper/ModuleHelper.php:200 12 Joomla\CMS\Helper\ModuleHelper::renderModule() Same as call in the line below. 11 call_user_func_array() JROOT/libraries/src/Cache/Controller/CallbackController.php:173 10 Joomla\CMS\Cache\Controller\CallbackController->get() JROOT/libraries/src/Helper/ModuleHelper.php:617 9 Joomla\CMS\Helper\ModuleHelper::moduleCache() JROOT/libraries/src/Document/Renderer/Html/ModuleRenderer.php:95 8 Joomla\CMS\Document\Renderer\Html\ModuleRenderer->render() JROOT/libraries/src/Document/Renderer/Html/ModulesRenderer.php:47 7 Joomla\CMS\Document\Renderer\Html\ModulesRenderer->render() JROOT/libraries/src/Document/HtmlDocument.php:511 6 Joomla\CMS\Document\HtmlDocument->getBuffer() JROOT/libraries/src/Document/HtmlDocument.php:803 5 Joomla\CMS\Document\HtmlDocument->_renderTemplate() JROOT/libraries/src/Document/HtmlDocument.php:577 4 Joomla\CMS\Document\HtmlDocument->render() JROOT/libraries/src/Application/CMSApplication.php:1112 3 Joomla\CMS\Application\CMSApplication->render() JROOT/libraries/src/Application/SiteApplication.php:778 2 Joomla\CMS\Application\SiteApplication->render() JROOT/libraries/src/Application/CMSApplication.php:231 1 Joomla\CMS\Application\CMSApplication->execute() JROOT/index.php:49 - Query Time: 0.32 ms After last query: 0.10 ms Query memory: 0.011 MB Memory before query: 29.178 MB Rows returned: 1
SELECT *
FROM w0v41_eventgallery_file
WHERE folder='DNS98'
AND file='DSC_06331.jpg'id select_type table partitions type possible_keys key key_len ref rows filtered Extra 1 SIMPLE w0v41_eventgallery_file NULL const file,index_file,index_folder file 754 const,const 1 100.00 NULL Status Duration starting 0.06 ms Executing hook on transaction 0.01 ms starting 0.01 ms checking permissions 0.01 ms Opening tables 0.03 ms init 0.01 ms System lock 0.01 ms optimizing 0.01 ms statistics 0.03 ms preparing 0.01 ms executing 0.03 ms end 0.01 ms query end 0.00 ms waiting for handler commit 0.01 ms closing tables 0.01 ms freeing items 0.05 ms cleaning up 0.01 ms # Caller File and line number 25 JDatabaseDriverMysqli->execute() JROOT/libraries/joomla/database/driver.php:1662 24 JDatabaseDriver->loadObject() JROOT/components/com_eventgallery/library/factory/file/local.php:47 23 EventgalleryLibraryFactoryFileLocal->getFileDBData() JROOT/components/com_eventgallery/library/factory/file/local.php:28 22 EventgalleryLibraryFactoryFileLocal->getFile() JROOT/components/com_eventgallery/library/factory/file.php:44 21 EventgalleryLibraryFactoryFile->getFile() JROOT/components/com_eventgallery/library/folder.php:559 20 EventgalleryLibraryFolder->getFiles() JROOT/plugins/content/eventgallery/eventgallery.php:187 19 PlgContentEventgallery->handleEventTag() JROOT/plugins/content/eventgallery/eventgallery.php:110 18 PlgContentEventgallery->replace() JROOT/plugins/content/eventgallery/eventgallery.php:103 17 PlgContentEventgallery->onContentPrepare() JROOT/libraries/joomla/event/event.php:70 16 JEvent->update() JROOT/libraries/joomla/event/dispatcher.php:160 15 JEventDispatcher->trigger() JROOT/modules/mod_k2_content/helper.php:472 14 modK2ContentHelper::getItems() JROOT/modules/mod_k2_content/mod_k2_content.php:65 13 include JROOT/modules/mod_k2_content/mod_k2_content.php JROOT/libraries/src/Helper/ModuleHelper.php:200 12 Joomla\CMS\Helper\ModuleHelper::renderModule() Same as call in the line below. 11 call_user_func_array() JROOT/libraries/src/Cache/Controller/CallbackController.php:173 10 Joomla\CMS\Cache\Controller\CallbackController->get() JROOT/libraries/src/Helper/ModuleHelper.php:617 9 Joomla\CMS\Helper\ModuleHelper::moduleCache() JROOT/libraries/src/Document/Renderer/Html/ModuleRenderer.php:95 8 Joomla\CMS\Document\Renderer\Html\ModuleRenderer->render() JROOT/libraries/src/Document/Renderer/Html/ModulesRenderer.php:47 7 Joomla\CMS\Document\Renderer\Html\ModulesRenderer->render() JROOT/libraries/src/Document/HtmlDocument.php:511 6 Joomla\CMS\Document\HtmlDocument->getBuffer() JROOT/libraries/src/Document/HtmlDocument.php:803 5 Joomla\CMS\Document\HtmlDocument->_renderTemplate() JROOT/libraries/src/Document/HtmlDocument.php:577 4 Joomla\CMS\Document\HtmlDocument->render() JROOT/libraries/src/Application/CMSApplication.php:1112 3 Joomla\CMS\Application\CMSApplication->render() JROOT/libraries/src/Application/SiteApplication.php:778 2 Joomla\CMS\Application\SiteApplication->render() JROOT/libraries/src/Application/CMSApplication.php:231 1 Joomla\CMS\Application\CMSApplication->execute() JROOT/index.php:49 - Query Time: 0.30 ms After last query: 0.09 ms Query memory: 0.011 MB Memory before query: 29.195 MB Rows returned: 1
SELECT *
FROM w0v41_eventgallery_file
WHERE folder='DNS98'
AND file='DSC_0636.JPG'id select_type table partitions type possible_keys key key_len ref rows filtered Extra 1 SIMPLE w0v41_eventgallery_file NULL const file,index_file,index_folder file 754 const,const 1 100.00 NULL Status Duration starting 0.06 ms Executing hook on transaction 0.00 ms starting 0.01 ms checking permissions 0.01 ms Opening tables 0.02 ms init 0.01 ms System lock 0.01 ms optimizing 0.01 ms statistics 0.03 ms preparing 0.01 ms executing 0.03 ms end 0.01 ms query end 0.00 ms waiting for handler commit 0.01 ms closing tables 0.01 ms freeing items 0.05 ms cleaning up 0.01 ms # Caller File and line number 25 JDatabaseDriverMysqli->execute() JROOT/libraries/joomla/database/driver.php:1662 24 JDatabaseDriver->loadObject() JROOT/components/com_eventgallery/library/factory/file/local.php:47 23 EventgalleryLibraryFactoryFileLocal->getFileDBData() JROOT/components/com_eventgallery/library/factory/file/local.php:28 22 EventgalleryLibraryFactoryFileLocal->getFile() JROOT/components/com_eventgallery/library/factory/file.php:44 21 EventgalleryLibraryFactoryFile->getFile() JROOT/components/com_eventgallery/library/folder.php:559 20 EventgalleryLibraryFolder->getFiles() JROOT/plugins/content/eventgallery/eventgallery.php:187 19 PlgContentEventgallery->handleEventTag() JROOT/plugins/content/eventgallery/eventgallery.php:110 18 PlgContentEventgallery->replace() JROOT/plugins/content/eventgallery/eventgallery.php:103 17 PlgContentEventgallery->onContentPrepare() JROOT/libraries/joomla/event/event.php:70 16 JEvent->update() JROOT/libraries/joomla/event/dispatcher.php:160 15 JEventDispatcher->trigger() JROOT/modules/mod_k2_content/helper.php:472 14 modK2ContentHelper::getItems() JROOT/modules/mod_k2_content/mod_k2_content.php:65 13 include JROOT/modules/mod_k2_content/mod_k2_content.php JROOT/libraries/src/Helper/ModuleHelper.php:200 12 Joomla\CMS\Helper\ModuleHelper::renderModule() Same as call in the line below. 11 call_user_func_array() JROOT/libraries/src/Cache/Controller/CallbackController.php:173 10 Joomla\CMS\Cache\Controller\CallbackController->get() JROOT/libraries/src/Helper/ModuleHelper.php:617 9 Joomla\CMS\Helper\ModuleHelper::moduleCache() JROOT/libraries/src/Document/Renderer/Html/ModuleRenderer.php:95 8 Joomla\CMS\Document\Renderer\Html\ModuleRenderer->render() JROOT/libraries/src/Document/Renderer/Html/ModulesRenderer.php:47 7 Joomla\CMS\Document\Renderer\Html\ModulesRenderer->render() JROOT/libraries/src/Document/HtmlDocument.php:511 6 Joomla\CMS\Document\HtmlDocument->getBuffer() JROOT/libraries/src/Document/HtmlDocument.php:803 5 Joomla\CMS\Document\HtmlDocument->_renderTemplate() JROOT/libraries/src/Document/HtmlDocument.php:577 4 Joomla\CMS\Document\HtmlDocument->render() JROOT/libraries/src/Application/CMSApplication.php:1112 3 Joomla\CMS\Application\CMSApplication->render() JROOT/libraries/src/Application/SiteApplication.php:778 2 Joomla\CMS\Application\SiteApplication->render() JROOT/libraries/src/Application/CMSApplication.php:231 1 Joomla\CMS\Application\CMSApplication->execute() JROOT/index.php:49 - Query Time: 0.31 ms After last query: 0.06 ms Query memory: 0.011 MB Memory before query: 29.211 MB Rows returned: 1
SELECT *
FROM w0v41_eventgallery_file
WHERE folder='DNS98'
AND file='DSC_0640.JPG'id select_type table partitions type possible_keys key key_len ref rows filtered Extra 1 SIMPLE w0v41_eventgallery_file NULL const file,index_file,index_folder file 754 const,const 1 100.00 NULL Status Duration starting 0.06 ms Executing hook on transaction 0.00 ms starting 0.01 ms checking permissions 0.01 ms Opening tables 0.02 ms init 0.00 ms System lock 0.01 ms optimizing 0.01 ms statistics 0.03 ms preparing 0.01 ms executing 0.03 ms end 0.01 ms query end 0.00 ms waiting for handler commit 0.01 ms closing tables 0.01 ms freeing items 0.06 ms cleaning up 0.01 ms # Caller File and line number 25 JDatabaseDriverMysqli->execute() JROOT/libraries/joomla/database/driver.php:1662 24 JDatabaseDriver->loadObject() JROOT/components/com_eventgallery/library/factory/file/local.php:47 23 EventgalleryLibraryFactoryFileLocal->getFileDBData() JROOT/components/com_eventgallery/library/factory/file/local.php:28 22 EventgalleryLibraryFactoryFileLocal->getFile() JROOT/components/com_eventgallery/library/factory/file.php:44 21 EventgalleryLibraryFactoryFile->getFile() JROOT/components/com_eventgallery/library/folder.php:559 20 EventgalleryLibraryFolder->getFiles() JROOT/plugins/content/eventgallery/eventgallery.php:187 19 PlgContentEventgallery->handleEventTag() JROOT/plugins/content/eventgallery/eventgallery.php:110 18 PlgContentEventgallery->replace() JROOT/plugins/content/eventgallery/eventgallery.php:103 17 PlgContentEventgallery->onContentPrepare() JROOT/libraries/joomla/event/event.php:70 16 JEvent->update() JROOT/libraries/joomla/event/dispatcher.php:160 15 JEventDispatcher->trigger() JROOT/modules/mod_k2_content/helper.php:472 14 modK2ContentHelper::getItems() JROOT/modules/mod_k2_content/mod_k2_content.php:65 13 include JROOT/modules/mod_k2_content/mod_k2_content.php JROOT/libraries/src/Helper/ModuleHelper.php:200 12 Joomla\CMS\Helper\ModuleHelper::renderModule() Same as call in the line below. 11 call_user_func_array() JROOT/libraries/src/Cache/Controller/CallbackController.php:173 10 Joomla\CMS\Cache\Controller\CallbackController->get() JROOT/libraries/src/Helper/ModuleHelper.php:617 9 Joomla\CMS\Helper\ModuleHelper::moduleCache() JROOT/libraries/src/Document/Renderer/Html/ModuleRenderer.php:95 8 Joomla\CMS\Document\Renderer\Html\ModuleRenderer->render() JROOT/libraries/src/Document/Renderer/Html/ModulesRenderer.php:47 7 Joomla\CMS\Document\Renderer\Html\ModulesRenderer->render() JROOT/libraries/src/Document/HtmlDocument.php:511 6 Joomla\CMS\Document\HtmlDocument->getBuffer() JROOT/libraries/src/Document/HtmlDocument.php:803 5 Joomla\CMS\Document\HtmlDocument->_renderTemplate() JROOT/libraries/src/Document/HtmlDocument.php:577 4 Joomla\CMS\Document\HtmlDocument->render() JROOT/libraries/src/Application/CMSApplication.php:1112 3 Joomla\CMS\Application\CMSApplication->render() JROOT/libraries/src/Application/SiteApplication.php:778 2 Joomla\CMS\Application\SiteApplication->render() JROOT/libraries/src/Application/CMSApplication.php:231 1 Joomla\CMS\Application\CMSApplication->execute() JROOT/index.php:49 - Query Time: 0.31 ms After last query: 0.11 ms Query memory: 0.011 MB Memory before query: 29.227 MB Rows returned: 1
SELECT *
FROM w0v41_eventgallery_file
WHERE folder='DNS98'
AND file='DSC_0645.JPG'id select_type table partitions type possible_keys key key_len ref rows filtered Extra 1 SIMPLE w0v41_eventgallery_file NULL const file,index_file,index_folder file 754 const,const 1 100.00 NULL Status Duration starting 0.06 ms Executing hook on transaction 0.01 ms starting 0.01 ms checking permissions 0.00 ms Opening tables 0.02 ms init 0.01 ms System lock 0.01 ms optimizing 0.01 ms statistics 0.03 ms preparing 0.01 ms executing 0.03 ms end 0.01 ms query end 0.00 ms waiting for handler commit 0.01 ms closing tables 0.01 ms freeing items 0.05 ms cleaning up 0.01 ms # Caller File and line number 25 JDatabaseDriverMysqli->execute() JROOT/libraries/joomla/database/driver.php:1662 24 JDatabaseDriver->loadObject() JROOT/components/com_eventgallery/library/factory/file/local.php:47 23 EventgalleryLibraryFactoryFileLocal->getFileDBData() JROOT/components/com_eventgallery/library/factory/file/local.php:28 22 EventgalleryLibraryFactoryFileLocal->getFile() JROOT/components/com_eventgallery/library/factory/file.php:44 21 EventgalleryLibraryFactoryFile->getFile() JROOT/components/com_eventgallery/library/folder.php:559 20 EventgalleryLibraryFolder->getFiles() JROOT/plugins/content/eventgallery/eventgallery.php:187 19 PlgContentEventgallery->handleEventTag() JROOT/plugins/content/eventgallery/eventgallery.php:110 18 PlgContentEventgallery->replace() JROOT/plugins/content/eventgallery/eventgallery.php:103 17 PlgContentEventgallery->onContentPrepare() JROOT/libraries/joomla/event/event.php:70 16 JEvent->update() JROOT/libraries/joomla/event/dispatcher.php:160 15 JEventDispatcher->trigger() JROOT/modules/mod_k2_content/helper.php:472 14 modK2ContentHelper::getItems() JROOT/modules/mod_k2_content/mod_k2_content.php:65 13 include JROOT/modules/mod_k2_content/mod_k2_content.php JROOT/libraries/src/Helper/ModuleHelper.php:200 12 Joomla\CMS\Helper\ModuleHelper::renderModule() Same as call in the line below. 11 call_user_func_array() JROOT/libraries/src/Cache/Controller/CallbackController.php:173 10 Joomla\CMS\Cache\Controller\CallbackController->get() JROOT/libraries/src/Helper/ModuleHelper.php:617 9 Joomla\CMS\Helper\ModuleHelper::moduleCache() JROOT/libraries/src/Document/Renderer/Html/ModuleRenderer.php:95 8 Joomla\CMS\Document\Renderer\Html\ModuleRenderer->render() JROOT/libraries/src/Document/Renderer/Html/ModulesRenderer.php:47 7 Joomla\CMS\Document\Renderer\Html\ModulesRenderer->render() JROOT/libraries/src/Document/HtmlDocument.php:511 6 Joomla\CMS\Document\HtmlDocument->getBuffer() JROOT/libraries/src/Document/HtmlDocument.php:803 5 Joomla\CMS\Document\HtmlDocument->_renderTemplate() JROOT/libraries/src/Document/HtmlDocument.php:577 4 Joomla\CMS\Document\HtmlDocument->render() JROOT/libraries/src/Application/CMSApplication.php:1112 3 Joomla\CMS\Application\CMSApplication->render() JROOT/libraries/src/Application/SiteApplication.php:778 2 Joomla\CMS\Application\SiteApplication->render() JROOT/libraries/src/Application/CMSApplication.php:231 1 Joomla\CMS\Application\CMSApplication->execute() JROOT/index.php:49 - Query Time: 0.31 ms After last query: 0.07 ms Query memory: 0.011 MB Memory before query: 29.245 MB Rows returned: 1
SELECT *
FROM w0v41_eventgallery_file
WHERE folder='DNS98'
AND file='DSC_0649.JPG'id select_type table partitions type possible_keys key key_len ref rows filtered Extra 1 SIMPLE w0v41_eventgallery_file NULL const file,index_file,index_folder file 754 const,const 1 100.00 NULL Status Duration starting 0.06 ms Executing hook on transaction 0.01 ms starting 0.01 ms checking permissions 0.01 ms Opening tables 0.03 ms init 0.01 ms System lock 0.01 ms optimizing 0.01 ms statistics 0.03 ms preparing 0.01 ms executing 0.03 ms end 0.01 ms query end 0.00 ms waiting for handler commit 0.01 ms closing tables 0.01 ms freeing items 0.05 ms cleaning up 0.01 ms # Caller File and line number 25 JDatabaseDriverMysqli->execute() JROOT/libraries/joomla/database/driver.php:1662 24 JDatabaseDriver->loadObject() JROOT/components/com_eventgallery/library/factory/file/local.php:47 23 EventgalleryLibraryFactoryFileLocal->getFileDBData() JROOT/components/com_eventgallery/library/factory/file/local.php:28 22 EventgalleryLibraryFactoryFileLocal->getFile() JROOT/components/com_eventgallery/library/factory/file.php:44 21 EventgalleryLibraryFactoryFile->getFile() JROOT/components/com_eventgallery/library/folder.php:559 20 EventgalleryLibraryFolder->getFiles() JROOT/plugins/content/eventgallery/eventgallery.php:187 19 PlgContentEventgallery->handleEventTag() JROOT/plugins/content/eventgallery/eventgallery.php:110 18 PlgContentEventgallery->replace() JROOT/plugins/content/eventgallery/eventgallery.php:103 17 PlgContentEventgallery->onContentPrepare() JROOT/libraries/joomla/event/event.php:70 16 JEvent->update() JROOT/libraries/joomla/event/dispatcher.php:160 15 JEventDispatcher->trigger() JROOT/modules/mod_k2_content/helper.php:472 14 modK2ContentHelper::getItems() JROOT/modules/mod_k2_content/mod_k2_content.php:65 13 include JROOT/modules/mod_k2_content/mod_k2_content.php JROOT/libraries/src/Helper/ModuleHelper.php:200 12 Joomla\CMS\Helper\ModuleHelper::renderModule() Same as call in the line below. 11 call_user_func_array() JROOT/libraries/src/Cache/Controller/CallbackController.php:173 10 Joomla\CMS\Cache\Controller\CallbackController->get() JROOT/libraries/src/Helper/ModuleHelper.php:617 9 Joomla\CMS\Helper\ModuleHelper::moduleCache() JROOT/libraries/src/Document/Renderer/Html/ModuleRenderer.php:95 8 Joomla\CMS\Document\Renderer\Html\ModuleRenderer->render() JROOT/libraries/src/Document/Renderer/Html/ModulesRenderer.php:47 7 Joomla\CMS\Document\Renderer\Html\ModulesRenderer->render() JROOT/libraries/src/Document/HtmlDocument.php:511 6 Joomla\CMS\Document\HtmlDocument->getBuffer() JROOT/libraries/src/Document/HtmlDocument.php:803 5 Joomla\CMS\Document\HtmlDocument->_renderTemplate() JROOT/libraries/src/Document/HtmlDocument.php:577 4 Joomla\CMS\Document\HtmlDocument->render() JROOT/libraries/src/Application/CMSApplication.php:1112 3 Joomla\CMS\Application\CMSApplication->render() JROOT/libraries/src/Application/SiteApplication.php:778 2 Joomla\CMS\Application\SiteApplication->render() JROOT/libraries/src/Application/CMSApplication.php:231 1 Joomla\CMS\Application\CMSApplication->execute() JROOT/index.php:49 - Query Time: 0.32 ms After last query: 0.08 ms Query memory: 0.011 MB Memory before query: 29.261 MB Rows returned: 1
SELECT *
FROM w0v41_eventgallery_file
WHERE folder='DNS98'
AND file='DSC_0652.JPG'id select_type table partitions type possible_keys key key_len ref rows filtered Extra 1 SIMPLE w0v41_eventgallery_file NULL const file,index_file,index_folder file 754 const,const 1 100.00 NULL Status Duration starting 0.07 ms Executing hook on transaction 0.01 ms starting 0.01 ms checking permissions 0.01 ms Opening tables 0.03 ms init 0.01 ms System lock 0.01 ms optimizing 0.01 ms statistics 0.03 ms preparing 0.01 ms executing 0.03 ms end 0.00 ms query end 0.00 ms waiting for handler commit 0.01 ms closing tables 0.01 ms freeing items 0.05 ms cleaning up 0.01 ms # Caller File and line number 25 JDatabaseDriverMysqli->execute() JROOT/libraries/joomla/database/driver.php:1662 24 JDatabaseDriver->loadObject() JROOT/components/com_eventgallery/library/factory/file/local.php:47 23 EventgalleryLibraryFactoryFileLocal->getFileDBData() JROOT/components/com_eventgallery/library/factory/file/local.php:28 22 EventgalleryLibraryFactoryFileLocal->getFile() JROOT/components/com_eventgallery/library/factory/file.php:44 21 EventgalleryLibraryFactoryFile->getFile() JROOT/components/com_eventgallery/library/folder.php:559 20 EventgalleryLibraryFolder->getFiles() JROOT/plugins/content/eventgallery/eventgallery.php:187 19 PlgContentEventgallery->handleEventTag() JROOT/plugins/content/eventgallery/eventgallery.php:110 18 PlgContentEventgallery->replace() JROOT/plugins/content/eventgallery/eventgallery.php:103 17 PlgContentEventgallery->onContentPrepare() JROOT/libraries/joomla/event/event.php:70 16 JEvent->update() JROOT/libraries/joomla/event/dispatcher.php:160 15 JEventDispatcher->trigger() JROOT/modules/mod_k2_content/helper.php:472 14 modK2ContentHelper::getItems() JROOT/modules/mod_k2_content/mod_k2_content.php:65 13 include JROOT/modules/mod_k2_content/mod_k2_content.php JROOT/libraries/src/Helper/ModuleHelper.php:200 12 Joomla\CMS\Helper\ModuleHelper::renderModule() Same as call in the line below. 11 call_user_func_array() JROOT/libraries/src/Cache/Controller/CallbackController.php:173 10 Joomla\CMS\Cache\Controller\CallbackController->get() JROOT/libraries/src/Helper/ModuleHelper.php:617 9 Joomla\CMS\Helper\ModuleHelper::moduleCache() JROOT/libraries/src/Document/Renderer/Html/ModuleRenderer.php:95 8 Joomla\CMS\Document\Renderer\Html\ModuleRenderer->render() JROOT/libraries/src/Document/Renderer/Html/ModulesRenderer.php:47 7 Joomla\CMS\Document\Renderer\Html\ModulesRenderer->render() JROOT/libraries/src/Document/HtmlDocument.php:511 6 Joomla\CMS\Document\HtmlDocument->getBuffer() JROOT/libraries/src/Document/HtmlDocument.php:803 5 Joomla\CMS\Document\HtmlDocument->_renderTemplate() JROOT/libraries/src/Document/HtmlDocument.php:577 4 Joomla\CMS\Document\HtmlDocument->render() JROOT/libraries/src/Application/CMSApplication.php:1112 3 Joomla\CMS\Application\CMSApplication->render() JROOT/libraries/src/Application/SiteApplication.php:778 2 Joomla\CMS\Application\SiteApplication->render() JROOT/libraries/src/Application/CMSApplication.php:231 1 Joomla\CMS\Application\CMSApplication->execute() JROOT/index.php:49 - Query Time: 0.31 ms After last query: 0.09 ms Query memory: 0.011 MB Memory before query: 29.278 MB Rows returned: 1
SELECT *
FROM w0v41_eventgallery_file
WHERE folder='DNS98'
AND file='DSC_0654.JPG'id select_type table partitions type possible_keys key key_len ref rows filtered Extra 1 SIMPLE w0v41_eventgallery_file NULL const file,index_file,index_folder file 754 const,const 1 100.00 NULL Status Duration starting 0.06 ms Executing hook on transaction 0.00 ms starting 0.01 ms checking permissions 0.00 ms Opening tables 0.02 ms init 0.01 ms System lock 0.01 ms optimizing 0.01 ms statistics 0.03 ms preparing 0.01 ms executing 0.03 ms end 0.01 ms query end 0.00 ms waiting for handler commit 0.01 ms closing tables 0.01 ms freeing items 0.05 ms cleaning up 0.01 ms # Caller File and line number 25 JDatabaseDriverMysqli->execute() JROOT/libraries/joomla/database/driver.php:1662 24 JDatabaseDriver->loadObject() JROOT/components/com_eventgallery/library/factory/file/local.php:47 23 EventgalleryLibraryFactoryFileLocal->getFileDBData() JROOT/components/com_eventgallery/library/factory/file/local.php:28 22 EventgalleryLibraryFactoryFileLocal->getFile() JROOT/components/com_eventgallery/library/factory/file.php:44 21 EventgalleryLibraryFactoryFile->getFile() JROOT/components/com_eventgallery/library/folder.php:559 20 EventgalleryLibraryFolder->getFiles() JROOT/plugins/content/eventgallery/eventgallery.php:187 19 PlgContentEventgallery->handleEventTag() JROOT/plugins/content/eventgallery/eventgallery.php:110 18 PlgContentEventgallery->replace() JROOT/plugins/content/eventgallery/eventgallery.php:103 17 PlgContentEventgallery->onContentPrepare() JROOT/libraries/joomla/event/event.php:70 16 JEvent->update() JROOT/libraries/joomla/event/dispatcher.php:160 15 JEventDispatcher->trigger() JROOT/modules/mod_k2_content/helper.php:472 14 modK2ContentHelper::getItems() JROOT/modules/mod_k2_content/mod_k2_content.php:65 13 include JROOT/modules/mod_k2_content/mod_k2_content.php JROOT/libraries/src/Helper/ModuleHelper.php:200 12 Joomla\CMS\Helper\ModuleHelper::renderModule() Same as call in the line below. 11 call_user_func_array() JROOT/libraries/src/Cache/Controller/CallbackController.php:173 10 Joomla\CMS\Cache\Controller\CallbackController->get() JROOT/libraries/src/Helper/ModuleHelper.php:617 9 Joomla\CMS\Helper\ModuleHelper::moduleCache() JROOT/libraries/src/Document/Renderer/Html/ModuleRenderer.php:95 8 Joomla\CMS\Document\Renderer\Html\ModuleRenderer->render() JROOT/libraries/src/Document/Renderer/Html/ModulesRenderer.php:47 7 Joomla\CMS\Document\Renderer\Html\ModulesRenderer->render() JROOT/libraries/src/Document/HtmlDocument.php:511 6 Joomla\CMS\Document\HtmlDocument->getBuffer() JROOT/libraries/src/Document/HtmlDocument.php:803 5 Joomla\CMS\Document\HtmlDocument->_renderTemplate() JROOT/libraries/src/Document/HtmlDocument.php:577 4 Joomla\CMS\Document\HtmlDocument->render() JROOT/libraries/src/Application/CMSApplication.php:1112 3 Joomla\CMS\Application\CMSApplication->render() JROOT/libraries/src/Application/SiteApplication.php:778 2 Joomla\CMS\Application\SiteApplication->render() JROOT/libraries/src/Application/CMSApplication.php:231 1 Joomla\CMS\Application\CMSApplication->execute() JROOT/index.php:49 - Query Time: 2.54 ms After last query: 9.18 ms Query memory: 0.011 MB Memory before query: 30.646 MB Rows returned: 6
SELECT `m`.`tag_id`,`t`.*
FROM `w0v41_contentitem_tag_map` AS m
INNER JOIN `w0v41_tags` AS t
ON `m`.`tag_id` = `t`.`id`
WHERE `m`.`type_alias` = 'com_eventgallery.event'
AND `m`.`content_item_id` = 4
AND `t`.`published` = 1
AND t.access IN (1,1,5)id select_type table partitions type possible_keys key key_len ref rows filtered Extra 1 SIMPLE m NULL ALL idx_tag_type NO INDEX KEY COULD BE USED NULL NULL 23 4.35 Using where 1 SIMPLE t NULL eq_ref PRIMARY,tag_idx,idx_access PRIMARY 4 h88876_SDAT.m.tag_id 1 100.00 Using where Status Duration starting 0.16 ms Executing hook on transaction 0.01 ms starting 0.01 ms checking permissions 0.01 ms checking permissions 0.01 ms Opening tables 1.85 ms init 0.01 ms System lock 0.01 ms optimizing 0.02 ms statistics 0.11 ms preparing 0.03 ms executing 0.12 ms end 0.01 ms query end 0.01 ms waiting for handler commit 0.01 ms closing tables 0.05 ms freeing items 0.06 ms cleaning up 0.02 ms # Caller File and line number 25 JDatabaseDriverMysqli->execute() JROOT/libraries/joomla/database/driver.php:1701 24 JDatabaseDriver->loadObjectList() JROOT/libraries/src/Helper/TagsHelper.php:454 23 Joomla\CMS\Helper\TagsHelper->getItemTags() JROOT/components/com_eventgallery/library/factory/tags.php:30 22 EventgalleryLibraryFactoryTags->getTagsForFolderId() JROOT/components/com_eventgallery/library/folder.php:590 21 EventgalleryLibraryFolder->getTags() JROOT/plugins/content/eventgallery/tmpl/event.php:15 20 include JROOT/plugins/content/eventgallery/tmpl/event.php JROOT/plugins/content/eventgallery/eventgallery.php:198 19 PlgContentEventgallery->handleEventTag() JROOT/plugins/content/eventgallery/eventgallery.php:110 18 PlgContentEventgallery->replace() JROOT/plugins/content/eventgallery/eventgallery.php:103 17 PlgContentEventgallery->onContentPrepare() JROOT/libraries/joomla/event/event.php:70 16 JEvent->update() JROOT/libraries/joomla/event/dispatcher.php:160 15 JEventDispatcher->trigger() JROOT/modules/mod_k2_content/helper.php:472 14 modK2ContentHelper::getItems() JROOT/modules/mod_k2_content/mod_k2_content.php:65 13 include JROOT/modules/mod_k2_content/mod_k2_content.php JROOT/libraries/src/Helper/ModuleHelper.php:200 12 Joomla\CMS\Helper\ModuleHelper::renderModule() Same as call in the line below. 11 call_user_func_array() JROOT/libraries/src/Cache/Controller/CallbackController.php:173 10 Joomla\CMS\Cache\Controller\CallbackController->get() JROOT/libraries/src/Helper/ModuleHelper.php:617 9 Joomla\CMS\Helper\ModuleHelper::moduleCache() JROOT/libraries/src/Document/Renderer/Html/ModuleRenderer.php:95 8 Joomla\CMS\Document\Renderer\Html\ModuleRenderer->render() JROOT/libraries/src/Document/Renderer/Html/ModulesRenderer.php:47 7 Joomla\CMS\Document\Renderer\Html\ModulesRenderer->render() JROOT/libraries/src/Document/HtmlDocument.php:511 6 Joomla\CMS\Document\HtmlDocument->getBuffer() JROOT/libraries/src/Document/HtmlDocument.php:803 5 Joomla\CMS\Document\HtmlDocument->_renderTemplate() JROOT/libraries/src/Document/HtmlDocument.php:577 4 Joomla\CMS\Document\HtmlDocument->render() JROOT/libraries/src/Application/CMSApplication.php:1112 3 Joomla\CMS\Application\CMSApplication->render() JROOT/libraries/src/Application/SiteApplication.php:778 2 Joomla\CMS\Application\SiteApplication->render() JROOT/libraries/src/Application/CMSApplication.php:231 1 Joomla\CMS\Application\CMSApplication->execute() JROOT/index.php:49 - Query Time: 0.74 ms After last query: 50.63 ms Query memory: 0.009 MB Memory before query: 30.673 MB Rows returned: 1
SELECT enabled
FROM w0v41_extensions
WHERE element = 'com_sppagebuilder'
AND type = 'component'id select_type table partitions type possible_keys key key_len ref rows filtered Extra 1 SIMPLE w0v41_extensions NULL ref element_clientid,element_folder_clientid,extension element_clientid 402 const 1 10.00 Using where Status Duration starting 0.25 ms Executing hook on transaction 0.01 ms starting 0.01 ms checking permissions 0.01 ms Opening tables 0.06 ms init 0.01 ms System lock 0.01 ms optimizing 0.02 ms statistics 0.12 ms preparing 0.03 ms executing 0.06 ms end 0.01 ms query end 0.01 ms waiting for handler commit 0.01 ms closing tables 0.01 ms freeing items 0.05 ms cleaning up 0.01 ms # Caller File and line number 20 JDatabaseDriverMysqli->execute() JROOT/libraries/joomla/database/driver.php:1740 19 JDatabaseDriver->loadResult() JROOT/plugins/k2/sppagebuilder/sppagebuilder.php:99 18 plgK2Sppagebuilder->isSppagebuilderEnabled() JROOT/plugins/k2/sppagebuilder/sppagebuilder.php:84 17 plgK2Sppagebuilder->onK2PrepareContent() JROOT/libraries/joomla/event/event.php:70 16 JEvent->update() JROOT/libraries/joomla/event/dispatcher.php:160 15 JEventDispatcher->trigger() JROOT/modules/mod_k2_content/helper.php:518 14 modK2ContentHelper::getItems() JROOT/modules/mod_k2_content/mod_k2_content.php:65 13 include JROOT/modules/mod_k2_content/mod_k2_content.php JROOT/libraries/src/Helper/ModuleHelper.php:200 12 Joomla\CMS\Helper\ModuleHelper::renderModule() Same as call in the line below. 11 call_user_func_array() JROOT/libraries/src/Cache/Controller/CallbackController.php:173 10 Joomla\CMS\Cache\Controller\CallbackController->get() JROOT/libraries/src/Helper/ModuleHelper.php:617 9 Joomla\CMS\Helper\ModuleHelper::moduleCache() JROOT/libraries/src/Document/Renderer/Html/ModuleRenderer.php:95 8 Joomla\CMS\Document\Renderer\Html\ModuleRenderer->render() JROOT/libraries/src/Document/Renderer/Html/ModulesRenderer.php:47 7 Joomla\CMS\Document\Renderer\Html\ModulesRenderer->render() JROOT/libraries/src/Document/HtmlDocument.php:511 6 Joomla\CMS\Document\HtmlDocument->getBuffer() JROOT/libraries/src/Document/HtmlDocument.php:803 5 Joomla\CMS\Document\HtmlDocument->_renderTemplate() JROOT/libraries/src/Document/HtmlDocument.php:577 4 Joomla\CMS\Document\HtmlDocument->render() JROOT/libraries/src/Application/CMSApplication.php:1112 3 Joomla\CMS\Application\CMSApplication->render() JROOT/libraries/src/Application/SiteApplication.php:778 2 Joomla\CMS\Application\SiteApplication->render() JROOT/libraries/src/Application/CMSApplication.php:231 1 Joomla\CMS\Application\CMSApplication->execute() JROOT/index.php:49 - Query Time: 1.40 ms After last query: 0.09 ms Query memory: 0.010 MB Memory before query: 30.685 MB Rows returned: 0Duplicate queries: #147
SELECT *
FROM `w0v41_sppagebuilder`
WHERE `extension` = 'com_k2'
AND `extension_view` = 'itemlist'
AND `view_id` = '95'
AND `active` = 1id select_type table partitions type possible_keys key key_len ref rows filtered Extra 1 SIMPLE w0v41_sppagebuilder NULL ALL NULL NO INDEX KEY COULD BE USED NULL NULL 131 0.76 Using where Status Duration starting 0.06 ms Executing hook on transaction 0.00 ms starting 0.01 ms checking permissions 0.00 ms Opening tables 0.05 ms init 0.01 ms System lock 0.01 ms optimizing 0.01 ms statistics 0.01 ms preparing 0.01 ms executing 1.09 ms end 0.01 ms query end 0.01 ms waiting for handler commit 0.01 ms closing tables 0.01 ms freeing items 0.06 ms cleaning up 0.01 ms # Caller File and line number 21 JDatabaseDriverMysqli->execute() JROOT/libraries/joomla/database/driver.php:1662 20 JDatabaseDriver->loadObject() JROOT/administrator/components/com_sppagebuilder/helpers/sppagebuilder.php:291 19 SppagebuilderHelper::getPageContent() JROOT/administrator/components/com_sppagebuilder/helpers/sppagebuilder.php:248 18 SppagebuilderHelper::onIntegrationPrepareContent() JROOT/plugins/k2/sppagebuilder/sppagebuilder.php:87 17 plgK2Sppagebuilder->onK2PrepareContent() JROOT/libraries/joomla/event/event.php:70 16 JEvent->update() JROOT/libraries/joomla/event/dispatcher.php:160 15 JEventDispatcher->trigger() JROOT/modules/mod_k2_content/helper.php:518 14 modK2ContentHelper::getItems() JROOT/modules/mod_k2_content/mod_k2_content.php:65 13 include JROOT/modules/mod_k2_content/mod_k2_content.php JROOT/libraries/src/Helper/ModuleHelper.php:200 12 Joomla\CMS\Helper\ModuleHelper::renderModule() Same as call in the line below. 11 call_user_func_array() JROOT/libraries/src/Cache/Controller/CallbackController.php:173 10 Joomla\CMS\Cache\Controller\CallbackController->get() JROOT/libraries/src/Helper/ModuleHelper.php:617 9 Joomla\CMS\Helper\ModuleHelper::moduleCache() JROOT/libraries/src/Document/Renderer/Html/ModuleRenderer.php:95 8 Joomla\CMS\Document\Renderer\Html\ModuleRenderer->render() JROOT/libraries/src/Document/Renderer/Html/ModulesRenderer.php:47 7 Joomla\CMS\Document\Renderer\Html\ModulesRenderer->render() JROOT/libraries/src/Document/HtmlDocument.php:511 6 Joomla\CMS\Document\HtmlDocument->getBuffer() JROOT/libraries/src/Document/HtmlDocument.php:803 5 Joomla\CMS\Document\HtmlDocument->_renderTemplate() JROOT/libraries/src/Document/HtmlDocument.php:577 4 Joomla\CMS\Document\HtmlDocument->render() JROOT/libraries/src/Application/CMSApplication.php:1112 3 Joomla\CMS\Application\CMSApplication->render() JROOT/libraries/src/Application/SiteApplication.php:778 2 Joomla\CMS\Application\SiteApplication->render() JROOT/libraries/src/Application/CMSApplication.php:231 1 Joomla\CMS\Application\CMSApplication->execute() JROOT/index.php:49 - Query Time: 0.79 ms After last query: 0.07 ms Query memory: 0.010 MB Memory before query: 30.694 MB Rows returned: 0Duplicate queries: #146
SELECT *
FROM `w0v41_sppagebuilder`
WHERE `extension` = 'com_k2'
AND `extension_view` = 'itemlist'
AND `view_id` = '95'
AND `active` = 1id select_type table partitions type possible_keys key key_len ref rows filtered Extra 1 SIMPLE w0v41_sppagebuilder NULL ALL NULL NO INDEX KEY COULD BE USED NULL NULL 131 0.76 Using where Status Duration starting 0.06 ms Executing hook on transaction 0.01 ms starting 0.01 ms checking permissions 0.01 ms Opening tables 0.03 ms init 0.00 ms System lock 0.01 ms optimizing 0.01 ms statistics 0.01 ms preparing 0.01 ms executing 0.54 ms end 0.01 ms query end 0.00 ms waiting for handler commit 0.01 ms closing tables 0.01 ms freeing items 0.05 ms cleaning up 0.01 ms # Caller File and line number 21 JDatabaseDriverMysqli->execute() JROOT/libraries/joomla/database/driver.php:1662 20 JDatabaseDriver->loadObject() JROOT/administrator/components/com_sppagebuilder/helpers/sppagebuilder.php:291 19 SppagebuilderHelper::getPageContent() JROOT/administrator/components/com_sppagebuilder/helpers/sppagebuilder.php:248 18 SppagebuilderHelper::onIntegrationPrepareContent() JROOT/plugins/k2/sppagebuilder/sppagebuilder.php:89 17 plgK2Sppagebuilder->onK2PrepareContent() JROOT/libraries/joomla/event/event.php:70 16 JEvent->update() JROOT/libraries/joomla/event/dispatcher.php:160 15 JEventDispatcher->trigger() JROOT/modules/mod_k2_content/helper.php:518 14 modK2ContentHelper::getItems() JROOT/modules/mod_k2_content/mod_k2_content.php:65 13 include JROOT/modules/mod_k2_content/mod_k2_content.php JROOT/libraries/src/Helper/ModuleHelper.php:200 12 Joomla\CMS\Helper\ModuleHelper::renderModule() Same as call in the line below. 11 call_user_func_array() JROOT/libraries/src/Cache/Controller/CallbackController.php:173 10 Joomla\CMS\Cache\Controller\CallbackController->get() JROOT/libraries/src/Helper/ModuleHelper.php:617 9 Joomla\CMS\Helper\ModuleHelper::moduleCache() JROOT/libraries/src/Document/Renderer/Html/ModuleRenderer.php:95 8 Joomla\CMS\Document\Renderer\Html\ModuleRenderer->render() JROOT/libraries/src/Document/Renderer/Html/ModulesRenderer.php:47 7 Joomla\CMS\Document\Renderer\Html\ModulesRenderer->render() JROOT/libraries/src/Document/HtmlDocument.php:511 6 Joomla\CMS\Document\HtmlDocument->getBuffer() JROOT/libraries/src/Document/HtmlDocument.php:803 5 Joomla\CMS\Document\HtmlDocument->_renderTemplate() JROOT/libraries/src/Document/HtmlDocument.php:577 4 Joomla\CMS\Document\HtmlDocument->render() JROOT/libraries/src/Application/CMSApplication.php:1112 3 Joomla\CMS\Application\CMSApplication->render() JROOT/libraries/src/Application/SiteApplication.php:778 2 Joomla\CMS\Application\SiteApplication->render() JROOT/libraries/src/Application/CMSApplication.php:231 1 Joomla\CMS\Application\CMSApplication->execute() JROOT/index.php:49 - Query Time: 0.26 ms After last query: 0.06 ms Query memory: 0.007 MB Memory before query: 30.701 MB Rows returned: 1
SELECT `description`, `gender`
FROM w0v41_k2_users
WHERE userID=112
LIMIT 0, 1id select_type table partitions type possible_keys key key_len ref rows filtered Extra 1 SIMPLE w0v41_k2_users NULL ref userID userID 4 const 1 100.00 NULL Status Duration starting 0.06 ms Executing hook on transaction 0.01 ms starting 0.01 ms checking permissions 0.00 ms Opening tables 0.02 ms init 0.00 ms System lock 0.01 ms optimizing 0.01 ms statistics 0.04 ms preparing 0.01 ms executing 0.02 ms end 0.00 ms query end 0.00 ms waiting for handler commit 0.01 ms closing tables 0.01 ms freeing items 0.04 ms cleaning up 0.01 ms # Caller File and line number 16 JDatabaseDriverMysqli->execute() JROOT/libraries/joomla/database/driver.php:1662 15 JDatabaseDriver->loadObject() JROOT/modules/mod_k2_content/helper.php:550 14 modK2ContentHelper::getItems() JROOT/modules/mod_k2_content/mod_k2_content.php:65 13 include JROOT/modules/mod_k2_content/mod_k2_content.php JROOT/libraries/src/Helper/ModuleHelper.php:200 12 Joomla\CMS\Helper\ModuleHelper::renderModule() Same as call in the line below. 11 call_user_func_array() JROOT/libraries/src/Cache/Controller/CallbackController.php:173 10 Joomla\CMS\Cache\Controller\CallbackController->get() JROOT/libraries/src/Helper/ModuleHelper.php:617 9 Joomla\CMS\Helper\ModuleHelper::moduleCache() JROOT/libraries/src/Document/Renderer/Html/ModuleRenderer.php:95 8 Joomla\CMS\Document\Renderer\Html\ModuleRenderer->render() JROOT/libraries/src/Document/Renderer/Html/ModulesRenderer.php:47 7 Joomla\CMS\Document\Renderer\Html\ModulesRenderer->render() JROOT/libraries/src/Document/HtmlDocument.php:511 6 Joomla\CMS\Document\HtmlDocument->getBuffer() JROOT/libraries/src/Document/HtmlDocument.php:803 5 Joomla\CMS\Document\HtmlDocument->_renderTemplate() JROOT/libraries/src/Document/HtmlDocument.php:577 4 Joomla\CMS\Document\HtmlDocument->render() JROOT/libraries/src/Application/CMSApplication.php:1112 3 Joomla\CMS\Application\CMSApplication->render() JROOT/libraries/src/Application/SiteApplication.php:778 2 Joomla\CMS\Application\SiteApplication->render() JROOT/libraries/src/Application/CMSApplication.php:231 1 Joomla\CMS\Application\CMSApplication->execute() JROOT/index.php:49 - Query Time: 0.36 ms After last query: 0.81 ms Query memory: 0.008 MB Memory before query: 30.709 MB Rows returned: 5
SELECT tag.*
FROM w0v41_k2_tags AS tag JOIN w0v41_k2_tags_xref AS xref
ON tag.id = xref.tagID
WHERE tag.published = 1
AND xref.itemID = 90
ORDER BY xref.id ASCid select_type table partitions type possible_keys key key_len ref rows filtered Extra 1 SIMPLE xref NULL ref tagID,itemID itemID 4 const 5 100.00 NULL 1 SIMPLE tag NULL eq_ref PRIMARY,published PRIMARY 4 h88876_SDAT.xref.tagID 1 100.00 Using where Status Duration starting 0.08 ms Executing hook on transaction 0.00 ms starting 0.01 ms checking permissions 0.00 ms checking permissions 0.00 ms Opening tables 0.03 ms init 0.00 ms System lock 0.01 ms optimizing 0.01 ms statistics 0.05 ms preparing 0.02 ms executing 0.06 ms end 0.01 ms query end 0.00 ms waiting for handler commit 0.01 ms closing tables 0.01 ms freeing items 0.04 ms cleaning up 0.01 ms # Caller File and line number 17 JDatabaseDriverMysqli->execute() JROOT/libraries/joomla/database/driver.php:1701 16 JDatabaseDriver->loadObjectList() JROOT/components/com_k2/models/item.php:1201 15 K2ModelItem->getItemTags() JROOT/modules/mod_k2_content/helper.php:303 14 modK2ContentHelper::getItems() JROOT/modules/mod_k2_content/mod_k2_content.php:65 13 include JROOT/modules/mod_k2_content/mod_k2_content.php JROOT/libraries/src/Helper/ModuleHelper.php:200 12 Joomla\CMS\Helper\ModuleHelper::renderModule() Same as call in the line below. 11 call_user_func_array() JROOT/libraries/src/Cache/Controller/CallbackController.php:173 10 Joomla\CMS\Cache\Controller\CallbackController->get() JROOT/libraries/src/Helper/ModuleHelper.php:617 9 Joomla\CMS\Helper\ModuleHelper::moduleCache() JROOT/libraries/src/Document/Renderer/Html/ModuleRenderer.php:95 8 Joomla\CMS\Document\Renderer\Html\ModuleRenderer->render() JROOT/libraries/src/Document/Renderer/Html/ModulesRenderer.php:47 7 Joomla\CMS\Document\Renderer\Html\ModulesRenderer->render() JROOT/libraries/src/Document/HtmlDocument.php:511 6 Joomla\CMS\Document\HtmlDocument->getBuffer() JROOT/libraries/src/Document/HtmlDocument.php:803 5 Joomla\CMS\Document\HtmlDocument->_renderTemplate() JROOT/libraries/src/Document/HtmlDocument.php:577 4 Joomla\CMS\Document\HtmlDocument->render() JROOT/libraries/src/Application/CMSApplication.php:1112 3 Joomla\CMS\Application\CMSApplication->render() JROOT/libraries/src/Application/SiteApplication.php:778 2 Joomla\CMS\Application\SiteApplication->render() JROOT/libraries/src/Application/CMSApplication.php:231 1 Joomla\CMS\Application\CMSApplication->execute() JROOT/index.php:49 - Query Time: 0.23 ms After last query: 1.25 ms Query memory: 0.008 MB Memory before query: 30.728 MB Rows returned: 0
SELECT *
FROM w0v41_k2_attachments
WHERE itemID=90id select_type table partitions type possible_keys key key_len ref rows filtered Extra 1 SIMPLE w0v41_k2_attachments NULL ref itemID itemID 4 const 1 100.00 NULL Status Duration starting 0.05 ms Executing hook on transaction 0.00 ms starting 0.01 ms checking permissions 0.00 ms Opening tables 0.02 ms init 0.00 ms System lock 0.01 ms optimizing 0.01 ms statistics 0.03 ms preparing 0.01 ms executing 0.01 ms end 0.00 ms query end 0.00 ms waiting for handler commit 0.01 ms closing tables 0.01 ms freeing items 0.04 ms cleaning up 0.01 ms # Caller File and line number 17 JDatabaseDriverMysqli->execute() JROOT/libraries/joomla/database/driver.php:1701 16 JDatabaseDriver->loadObjectList() JROOT/components/com_k2/models/item.php:1429 15 K2ModelItem->getItemAttachments() JROOT/modules/mod_k2_content/helper.php:437 14 modK2ContentHelper::getItems() JROOT/modules/mod_k2_content/mod_k2_content.php:65 13 include JROOT/modules/mod_k2_content/mod_k2_content.php JROOT/libraries/src/Helper/ModuleHelper.php:200 12 Joomla\CMS\Helper\ModuleHelper::renderModule() Same as call in the line below. 11 call_user_func_array() JROOT/libraries/src/Cache/Controller/CallbackController.php:173 10 Joomla\CMS\Cache\Controller\CallbackController->get() JROOT/libraries/src/Helper/ModuleHelper.php:617 9 Joomla\CMS\Helper\ModuleHelper::moduleCache() JROOT/libraries/src/Document/Renderer/Html/ModuleRenderer.php:95 8 Joomla\CMS\Document\Renderer\Html\ModuleRenderer->render() JROOT/libraries/src/Document/Renderer/Html/ModulesRenderer.php:47 7 Joomla\CMS\Document\Renderer\Html\ModulesRenderer->render() JROOT/libraries/src/Document/HtmlDocument.php:511 6 Joomla\CMS\Document\HtmlDocument->getBuffer() JROOT/libraries/src/Document/HtmlDocument.php:803 5 Joomla\CMS\Document\HtmlDocument->_renderTemplate() JROOT/libraries/src/Document/HtmlDocument.php:577 4 Joomla\CMS\Document\HtmlDocument->render() JROOT/libraries/src/Application/CMSApplication.php:1112 3 Joomla\CMS\Application\CMSApplication->render() JROOT/libraries/src/Application/SiteApplication.php:778 2 Joomla\CMS\Application\SiteApplication->render() JROOT/libraries/src/Application/CMSApplication.php:231 1 Joomla\CMS\Application\CMSApplication->execute() JROOT/index.php:49 - Query Time: 0.25 ms After last query: 0.04 ms Query memory: 0.008 MB Memory before query: 30.736 MB Rows returned: 1
SELECT COUNT(*)
FROM w0v41_k2_comments
WHERE itemID=90
AND published=1id select_type table partitions type possible_keys key key_len ref rows filtered Extra 1 SIMPLE w0v41_k2_comments NULL ref itemID,published,latestComments,countComments countComments 8 const,const 1 100.00 Using index Status Duration starting 0.05 ms Executing hook on transaction 0.00 ms starting 0.00 ms checking permissions 0.00 ms Opening tables 0.02 ms init 0.00 ms System lock 0.01 ms optimizing 0.01 ms statistics 0.04 ms preparing 0.02 ms executing 0.01 ms end 0.00 ms query end 0.00 ms waiting for handler commit 0.01 ms closing tables 0.01 ms freeing items 0.04 ms cleaning up 0.01 ms # Caller File and line number 17 JDatabaseDriverMysqli->execute() JROOT/libraries/joomla/database/driver.php:1740 16 JDatabaseDriver->loadResult() JROOT/components/com_k2/models/item.php:1468 15 K2ModelItem->countItemComments() JROOT/modules/mod_k2_content/helper.php:442 14 modK2ContentHelper::getItems() JROOT/modules/mod_k2_content/mod_k2_content.php:65 13 include JROOT/modules/mod_k2_content/mod_k2_content.php JROOT/libraries/src/Helper/ModuleHelper.php:200 12 Joomla\CMS\Helper\ModuleHelper::renderModule() Same as call in the line below. 11 call_user_func_array() JROOT/libraries/src/Cache/Controller/CallbackController.php:173 10 Joomla\CMS\Cache\Controller\CallbackController->get() JROOT/libraries/src/Helper/ModuleHelper.php:617 9 Joomla\CMS\Helper\ModuleHelper::moduleCache() JROOT/libraries/src/Document/Renderer/Html/ModuleRenderer.php:95 8 Joomla\CMS\Document\Renderer\Html\ModuleRenderer->render() JROOT/libraries/src/Document/Renderer/Html/ModulesRenderer.php:47 7 Joomla\CMS\Document\Renderer\Html\ModulesRenderer->render() JROOT/libraries/src/Document/HtmlDocument.php:511 6 Joomla\CMS\Document\HtmlDocument->getBuffer() JROOT/libraries/src/Document/HtmlDocument.php:803 5 Joomla\CMS\Document\HtmlDocument->_renderTemplate() JROOT/libraries/src/Document/HtmlDocument.php:577 4 Joomla\CMS\Document\HtmlDocument->render() JROOT/libraries/src/Application/CMSApplication.php:1112 3 Joomla\CMS\Application\CMSApplication->render() JROOT/libraries/src/Application/SiteApplication.php:778 2 Joomla\CMS\Application\SiteApplication->render() JROOT/libraries/src/Application/CMSApplication.php:231 1 Joomla\CMS\Application\CMSApplication->execute() JROOT/index.php:49 - Query Time: 0.28 ms After last query: 0.76 ms Query memory: 0.009 MB Memory before query: 30.746 MB Rows returned: 1
SELECT enabled
FROM w0v41_extensions
WHERE element = 'com_sppagebuilder'
AND type = 'component'id select_type table partitions type possible_keys key key_len ref rows filtered Extra 1 SIMPLE w0v41_extensions NULL ref element_clientid,element_folder_clientid,extension element_clientid 402 const 1 10.00 Using where Status Duration starting 0.06 ms Executing hook on transaction 0.01 ms starting 0.00 ms checking permissions 0.01 ms Opening tables 0.02 ms init 0.01 ms System lock 0.01 ms optimizing 0.01 ms statistics 0.05 ms preparing 0.01 ms executing 0.02 ms end 0.01 ms query end 0.00 ms waiting for handler commit 0.01 ms closing tables 0.01 ms freeing items 0.04 ms cleaning up 0.01 ms # Caller File and line number 20 JDatabaseDriverMysqli->execute() JROOT/libraries/joomla/database/driver.php:1740 19 JDatabaseDriver->loadResult() JROOT/plugins/k2/sppagebuilder/sppagebuilder.php:99 18 plgK2Sppagebuilder->isSppagebuilderEnabled() JROOT/plugins/k2/sppagebuilder/sppagebuilder.php:84 17 plgK2Sppagebuilder->onK2PrepareContent() JROOT/libraries/joomla/event/event.php:70 16 JEvent->update() JROOT/libraries/joomla/event/dispatcher.php:160 15 JEventDispatcher->trigger() JROOT/modules/mod_k2_content/helper.php:518 14 modK2ContentHelper::getItems() JROOT/modules/mod_k2_content/mod_k2_content.php:65 13 include JROOT/modules/mod_k2_content/mod_k2_content.php JROOT/libraries/src/Helper/ModuleHelper.php:200 12 Joomla\CMS\Helper\ModuleHelper::renderModule() Same as call in the line below. 11 call_user_func_array() JROOT/libraries/src/Cache/Controller/CallbackController.php:173 10 Joomla\CMS\Cache\Controller\CallbackController->get() JROOT/libraries/src/Helper/ModuleHelper.php:617 9 Joomla\CMS\Helper\ModuleHelper::moduleCache() JROOT/libraries/src/Document/Renderer/Html/ModuleRenderer.php:95 8 Joomla\CMS\Document\Renderer\Html\ModuleRenderer->render() JROOT/libraries/src/Document/Renderer/Html/ModulesRenderer.php:47 7 Joomla\CMS\Document\Renderer\Html\ModulesRenderer->render() JROOT/libraries/src/Document/HtmlDocument.php:511 6 Joomla\CMS\Document\HtmlDocument->getBuffer() JROOT/libraries/src/Document/HtmlDocument.php:803 5 Joomla\CMS\Document\HtmlDocument->_renderTemplate() JROOT/libraries/src/Document/HtmlDocument.php:577 4 Joomla\CMS\Document\HtmlDocument->render() JROOT/libraries/src/Application/CMSApplication.php:1112 3 Joomla\CMS\Application\CMSApplication->render() JROOT/libraries/src/Application/SiteApplication.php:778 2 Joomla\CMS\Application\SiteApplication->render() JROOT/libraries/src/Application/CMSApplication.php:231 1 Joomla\CMS\Application\CMSApplication->execute() JROOT/index.php:49 - Query Time: 0.86 ms After last query: 0.06 ms Query memory: 0.010 MB Memory before query: 30.757 MB Rows returned: 0Duplicate queries: #154
SELECT *
FROM `w0v41_sppagebuilder`
WHERE `extension` = 'com_k2'
AND `extension_view` = 'itemlist'
AND `view_id` = '90'
AND `active` = 1id select_type table partitions type possible_keys key key_len ref rows filtered Extra 1 SIMPLE w0v41_sppagebuilder NULL ALL NULL NO INDEX KEY COULD BE USED NULL NULL 131 0.76 Using where Status Duration starting 0.05 ms Executing hook on transaction 0.01 ms starting 0.01 ms checking permissions 0.00 ms Opening tables 0.02 ms init 0.00 ms System lock 0.01 ms optimizing 0.01 ms statistics 0.01 ms preparing 0.01 ms executing 0.62 ms end 0.01 ms query end 0.01 ms waiting for handler commit 0.01 ms closing tables 0.01 ms freeing items 0.05 ms cleaning up 0.01 ms # Caller File and line number 21 JDatabaseDriverMysqli->execute() JROOT/libraries/joomla/database/driver.php:1662 20 JDatabaseDriver->loadObject() JROOT/administrator/components/com_sppagebuilder/helpers/sppagebuilder.php:291 19 SppagebuilderHelper::getPageContent() JROOT/administrator/components/com_sppagebuilder/helpers/sppagebuilder.php:248 18 SppagebuilderHelper::onIntegrationPrepareContent() JROOT/plugins/k2/sppagebuilder/sppagebuilder.php:87 17 plgK2Sppagebuilder->onK2PrepareContent() JROOT/libraries/joomla/event/event.php:70 16 JEvent->update() JROOT/libraries/joomla/event/dispatcher.php:160 15 JEventDispatcher->trigger() JROOT/modules/mod_k2_content/helper.php:518 14 modK2ContentHelper::getItems() JROOT/modules/mod_k2_content/mod_k2_content.php:65 13 include JROOT/modules/mod_k2_content/mod_k2_content.php JROOT/libraries/src/Helper/ModuleHelper.php:200 12 Joomla\CMS\Helper\ModuleHelper::renderModule() Same as call in the line below. 11 call_user_func_array() JROOT/libraries/src/Cache/Controller/CallbackController.php:173 10 Joomla\CMS\Cache\Controller\CallbackController->get() JROOT/libraries/src/Helper/ModuleHelper.php:617 9 Joomla\CMS\Helper\ModuleHelper::moduleCache() JROOT/libraries/src/Document/Renderer/Html/ModuleRenderer.php:95 8 Joomla\CMS\Document\Renderer\Html\ModuleRenderer->render() JROOT/libraries/src/Document/Renderer/Html/ModulesRenderer.php:47 7 Joomla\CMS\Document\Renderer\Html\ModulesRenderer->render() JROOT/libraries/src/Document/HtmlDocument.php:511 6 Joomla\CMS\Document\HtmlDocument->getBuffer() JROOT/libraries/src/Document/HtmlDocument.php:803 5 Joomla\CMS\Document\HtmlDocument->_renderTemplate() JROOT/libraries/src/Document/HtmlDocument.php:577 4 Joomla\CMS\Document\HtmlDocument->render() JROOT/libraries/src/Application/CMSApplication.php:1112 3 Joomla\CMS\Application\CMSApplication->render() JROOT/libraries/src/Application/SiteApplication.php:778 2 Joomla\CMS\Application\SiteApplication->render() JROOT/libraries/src/Application/CMSApplication.php:231 1 Joomla\CMS\Application\CMSApplication->execute() JROOT/index.php:49 - Query Time: 0.75 ms After last query: 0.08 ms Query memory: 0.010 MB Memory before query: 30.767 MB Rows returned: 0Duplicate queries: #153
SELECT *
FROM `w0v41_sppagebuilder`
WHERE `extension` = 'com_k2'
AND `extension_view` = 'itemlist'
AND `view_id` = '90'
AND `active` = 1id select_type table partitions type possible_keys key key_len ref rows filtered Extra 1 SIMPLE w0v41_sppagebuilder NULL ALL NULL NO INDEX KEY COULD BE USED NULL NULL 131 0.76 Using where Status Duration starting 0.06 ms Executing hook on transaction 0.00 ms starting 0.01 ms checking permissions 0.01 ms Opening tables 0.02 ms init 0.01 ms System lock 0.01 ms optimizing 0.01 ms statistics 0.01 ms preparing 0.01 ms executing 0.51 ms end 0.01 ms query end 0.00 ms waiting for handler commit 0.01 ms closing tables 0.01 ms freeing items 0.05 ms cleaning up 0.01 ms # Caller File and line number 21 JDatabaseDriverMysqli->execute() JROOT/libraries/joomla/database/driver.php:1662 20 JDatabaseDriver->loadObject() JROOT/administrator/components/com_sppagebuilder/helpers/sppagebuilder.php:291 19 SppagebuilderHelper::getPageContent() JROOT/administrator/components/com_sppagebuilder/helpers/sppagebuilder.php:248 18 SppagebuilderHelper::onIntegrationPrepareContent() JROOT/plugins/k2/sppagebuilder/sppagebuilder.php:89 17 plgK2Sppagebuilder->onK2PrepareContent() JROOT/libraries/joomla/event/event.php:70 16 JEvent->update() JROOT/libraries/joomla/event/dispatcher.php:160 15 JEventDispatcher->trigger() JROOT/modules/mod_k2_content/helper.php:518 14 modK2ContentHelper::getItems() JROOT/modules/mod_k2_content/mod_k2_content.php:65 13 include JROOT/modules/mod_k2_content/mod_k2_content.php JROOT/libraries/src/Helper/ModuleHelper.php:200 12 Joomla\CMS\Helper\ModuleHelper::renderModule() Same as call in the line below. 11 call_user_func_array() JROOT/libraries/src/Cache/Controller/CallbackController.php:173 10 Joomla\CMS\Cache\Controller\CallbackController->get() JROOT/libraries/src/Helper/ModuleHelper.php:617 9 Joomla\CMS\Helper\ModuleHelper::moduleCache() JROOT/libraries/src/Document/Renderer/Html/ModuleRenderer.php:95 8 Joomla\CMS\Document\Renderer\Html\ModuleRenderer->render() JROOT/libraries/src/Document/Renderer/Html/ModulesRenderer.php:47 7 Joomla\CMS\Document\Renderer\Html\ModulesRenderer->render() JROOT/libraries/src/Document/HtmlDocument.php:511 6 Joomla\CMS\Document\HtmlDocument->getBuffer() JROOT/libraries/src/Document/HtmlDocument.php:803 5 Joomla\CMS\Document\HtmlDocument->_renderTemplate() JROOT/libraries/src/Document/HtmlDocument.php:577 4 Joomla\CMS\Document\HtmlDocument->render() JROOT/libraries/src/Application/CMSApplication.php:1112 3 Joomla\CMS\Application\CMSApplication->render() JROOT/libraries/src/Application/SiteApplication.php:778 2 Joomla\CMS\Application\SiteApplication->render() JROOT/libraries/src/Application/CMSApplication.php:231 1 Joomla\CMS\Application\CMSApplication->execute() JROOT/index.php:49 - Query Time: 0.27 ms After last query: 0.05 ms Query memory: 0.007 MB Memory before query: 30.774 MB Rows returned: 1
SELECT `description`, `gender`
FROM w0v41_k2_users
WHERE userID=112
LIMIT 0, 1id select_type table partitions type possible_keys key key_len ref rows filtered Extra 1 SIMPLE w0v41_k2_users NULL ref userID userID 4 const 1 100.00 NULL Status Duration starting 0.07 ms Executing hook on transaction 0.01 ms starting 0.01 ms checking permissions 0.00 ms Opening tables 0.02 ms init 0.01 ms System lock 0.01 ms optimizing 0.01 ms statistics 0.03 ms preparing 0.01 ms executing 0.02 ms end 0.01 ms query end 0.00 ms waiting for handler commit 0.01 ms closing tables 0.01 ms freeing items 0.04 ms cleaning up 0.01 ms # Caller File and line number 16 JDatabaseDriverMysqli->execute() JROOT/libraries/joomla/database/driver.php:1662 15 JDatabaseDriver->loadObject() JROOT/modules/mod_k2_content/helper.php:550 14 modK2ContentHelper::getItems() JROOT/modules/mod_k2_content/mod_k2_content.php:65 13 include JROOT/modules/mod_k2_content/mod_k2_content.php JROOT/libraries/src/Helper/ModuleHelper.php:200 12 Joomla\CMS\Helper\ModuleHelper::renderModule() Same as call in the line below. 11 call_user_func_array() JROOT/libraries/src/Cache/Controller/CallbackController.php:173 10 Joomla\CMS\Cache\Controller\CallbackController->get() JROOT/libraries/src/Helper/ModuleHelper.php:617 9 Joomla\CMS\Helper\ModuleHelper::moduleCache() JROOT/libraries/src/Document/Renderer/Html/ModuleRenderer.php:95 8 Joomla\CMS\Document\Renderer\Html\ModuleRenderer->render() JROOT/libraries/src/Document/Renderer/Html/ModulesRenderer.php:47 7 Joomla\CMS\Document\Renderer\Html\ModulesRenderer->render() JROOT/libraries/src/Document/HtmlDocument.php:511 6 Joomla\CMS\Document\HtmlDocument->getBuffer() JROOT/libraries/src/Document/HtmlDocument.php:803 5 Joomla\CMS\Document\HtmlDocument->_renderTemplate() JROOT/libraries/src/Document/HtmlDocument.php:577 4 Joomla\CMS\Document\HtmlDocument->render() JROOT/libraries/src/Application/CMSApplication.php:1112 3 Joomla\CMS\Application\CMSApplication->render() JROOT/libraries/src/Application/SiteApplication.php:778 2 Joomla\CMS\Application\SiteApplication->render() JROOT/libraries/src/Application/CMSApplication.php:231 1 Joomla\CMS\Application\CMSApplication->execute() JROOT/index.php:49 - Query Time: 0.34 ms After last query: 0.61 ms Query memory: 0.008 MB Memory before query: 30.782 MB Rows returned: 4
SELECT tag.*
FROM w0v41_k2_tags AS tag JOIN w0v41_k2_tags_xref AS xref
ON tag.id = xref.tagID
WHERE tag.published = 1
AND xref.itemID = 89
ORDER BY xref.id ASCid select_type table partitions type possible_keys key key_len ref rows filtered Extra 1 SIMPLE xref NULL ref tagID,itemID itemID 4 const 4 100.00 NULL 1 SIMPLE tag NULL eq_ref PRIMARY,published PRIMARY 4 h88876_SDAT.xref.tagID 1 100.00 Using where Status Duration starting 0.08 ms Executing hook on transaction 0.01 ms starting 0.01 ms checking permissions 0.01 ms checking permissions 0.00 ms Opening tables 0.02 ms init 0.01 ms System lock 0.01 ms optimizing 0.01 ms statistics 0.04 ms preparing 0.02 ms executing 0.04 ms end 0.01 ms query end 0.00 ms waiting for handler commit 0.01 ms closing tables 0.01 ms freeing items 0.05 ms cleaning up 0.01 ms # Caller File and line number 17 JDatabaseDriverMysqli->execute() JROOT/libraries/joomla/database/driver.php:1701 16 JDatabaseDriver->loadObjectList() JROOT/components/com_k2/models/item.php:1201 15 K2ModelItem->getItemTags() JROOT/modules/mod_k2_content/helper.php:303 14 modK2ContentHelper::getItems() JROOT/modules/mod_k2_content/mod_k2_content.php:65 13 include JROOT/modules/mod_k2_content/mod_k2_content.php JROOT/libraries/src/Helper/ModuleHelper.php:200 12 Joomla\CMS\Helper\ModuleHelper::renderModule() Same as call in the line below. 11 call_user_func_array() JROOT/libraries/src/Cache/Controller/CallbackController.php:173 10 Joomla\CMS\Cache\Controller\CallbackController->get() JROOT/libraries/src/Helper/ModuleHelper.php:617 9 Joomla\CMS\Helper\ModuleHelper::moduleCache() JROOT/libraries/src/Document/Renderer/Html/ModuleRenderer.php:95 8 Joomla\CMS\Document\Renderer\Html\ModuleRenderer->render() JROOT/libraries/src/Document/Renderer/Html/ModulesRenderer.php:47 7 Joomla\CMS\Document\Renderer\Html\ModulesRenderer->render() JROOT/libraries/src/Document/HtmlDocument.php:511 6 Joomla\CMS\Document\HtmlDocument->getBuffer() JROOT/libraries/src/Document/HtmlDocument.php:803 5 Joomla\CMS\Document\HtmlDocument->_renderTemplate() JROOT/libraries/src/Document/HtmlDocument.php:577 4 Joomla\CMS\Document\HtmlDocument->render() JROOT/libraries/src/Application/CMSApplication.php:1112 3 Joomla\CMS\Application\CMSApplication->render() JROOT/libraries/src/Application/SiteApplication.php:778 2 Joomla\CMS\Application\SiteApplication->render() JROOT/libraries/src/Application/CMSApplication.php:231 1 Joomla\CMS\Application\CMSApplication->execute() JROOT/index.php:49 - Query Time: 0.26 ms After last query: 0.77 ms Query memory: 0.008 MB Memory before query: 30.797 MB Rows returned: 0
SELECT *
FROM w0v41_k2_attachments
WHERE itemID=89id select_type table partitions type possible_keys key key_len ref rows filtered Extra 1 SIMPLE w0v41_k2_attachments NULL ref itemID itemID 4 const 1 100.00 NULL Status Duration starting 0.07 ms Executing hook on transaction 0.01 ms starting 0.01 ms checking permissions 0.00 ms Opening tables 0.02 ms init 0.01 ms System lock 0.01 ms optimizing 0.01 ms statistics 0.02 ms preparing 0.01 ms executing 0.02 ms end 0.01 ms query end 0.00 ms waiting for handler commit 0.01 ms closing tables 0.01 ms freeing items 0.04 ms cleaning up 0.01 ms # Caller File and line number 17 JDatabaseDriverMysqli->execute() JROOT/libraries/joomla/database/driver.php:1701 16 JDatabaseDriver->loadObjectList() JROOT/components/com_k2/models/item.php:1429 15 K2ModelItem->getItemAttachments() JROOT/modules/mod_k2_content/helper.php:437 14 modK2ContentHelper::getItems() JROOT/modules/mod_k2_content/mod_k2_content.php:65 13 include JROOT/modules/mod_k2_content/mod_k2_content.php JROOT/libraries/src/Helper/ModuleHelper.php:200 12 Joomla\CMS\Helper\ModuleHelper::renderModule() Same as call in the line below. 11 call_user_func_array() JROOT/libraries/src/Cache/Controller/CallbackController.php:173 10 Joomla\CMS\Cache\Controller\CallbackController->get() JROOT/libraries/src/Helper/ModuleHelper.php:617 9 Joomla\CMS\Helper\ModuleHelper::moduleCache() JROOT/libraries/src/Document/Renderer/Html/ModuleRenderer.php:95 8 Joomla\CMS\Document\Renderer\Html\ModuleRenderer->render() JROOT/libraries/src/Document/Renderer/Html/ModulesRenderer.php:47 7 Joomla\CMS\Document\Renderer\Html\ModulesRenderer->render() JROOT/libraries/src/Document/HtmlDocument.php:511 6 Joomla\CMS\Document\HtmlDocument->getBuffer() JROOT/libraries/src/Document/HtmlDocument.php:803 5 Joomla\CMS\Document\HtmlDocument->_renderTemplate() JROOT/libraries/src/Document/HtmlDocument.php:577 4 Joomla\CMS\Document\HtmlDocument->render() JROOT/libraries/src/Application/CMSApplication.php:1112 3 Joomla\CMS\Application\CMSApplication->render() JROOT/libraries/src/Application/SiteApplication.php:778 2 Joomla\CMS\Application\SiteApplication->render() JROOT/libraries/src/Application/CMSApplication.php:231 1 Joomla\CMS\Application\CMSApplication->execute() JROOT/index.php:49 - Query Time: 0.26 ms After last query: 0.04 ms Query memory: 0.008 MB Memory before query: 30.806 MB Rows returned: 1
SELECT COUNT(*)
FROM w0v41_k2_comments
WHERE itemID=89
AND published=1id select_type table partitions type possible_keys key key_len ref rows filtered Extra 1 SIMPLE w0v41_k2_comments NULL ref itemID,published,latestComments,countComments countComments 8 const,const 1 100.00 Using index Status Duration starting 0.06 ms Executing hook on transaction 0.01 ms starting 0.01 ms checking permissions 0.00 ms Opening tables 0.01 ms init 0.00 ms System lock 0.01 ms optimizing 0.01 ms statistics 0.04 ms preparing 0.01 ms executing 0.01 ms end 0.01 ms query end 0.00 ms waiting for handler commit 0.01 ms closing tables 0.01 ms freeing items 0.04 ms cleaning up 0.01 ms # Caller File and line number 17 JDatabaseDriverMysqli->execute() JROOT/libraries/joomla/database/driver.php:1740 16 JDatabaseDriver->loadResult() JROOT/components/com_k2/models/item.php:1468 15 K2ModelItem->countItemComments() JROOT/modules/mod_k2_content/helper.php:442 14 modK2ContentHelper::getItems() JROOT/modules/mod_k2_content/mod_k2_content.php:65 13 include JROOT/modules/mod_k2_content/mod_k2_content.php JROOT/libraries/src/Helper/ModuleHelper.php:200 12 Joomla\CMS\Helper\ModuleHelper::renderModule() Same as call in the line below. 11 call_user_func_array() JROOT/libraries/src/Cache/Controller/CallbackController.php:173 10 Joomla\CMS\Cache\Controller\CallbackController->get() JROOT/libraries/src/Helper/ModuleHelper.php:617 9 Joomla\CMS\Helper\ModuleHelper::moduleCache() JROOT/libraries/src/Document/Renderer/Html/ModuleRenderer.php:95 8 Joomla\CMS\Document\Renderer\Html\ModuleRenderer->render() JROOT/libraries/src/Document/Renderer/Html/ModulesRenderer.php:47 7 Joomla\CMS\Document\Renderer\Html\ModulesRenderer->render() JROOT/libraries/src/Document/HtmlDocument.php:511 6 Joomla\CMS\Document\HtmlDocument->getBuffer() JROOT/libraries/src/Document/HtmlDocument.php:803 5 Joomla\CMS\Document\HtmlDocument->_renderTemplate() JROOT/libraries/src/Document/HtmlDocument.php:577 4 Joomla\CMS\Document\HtmlDocument->render() JROOT/libraries/src/Application/CMSApplication.php:1112 3 Joomla\CMS\Application\CMSApplication->render() JROOT/libraries/src/Application/SiteApplication.php:778 2 Joomla\CMS\Application\SiteApplication->render() JROOT/libraries/src/Application/CMSApplication.php:231 1 Joomla\CMS\Application\CMSApplication->execute() JROOT/index.php:49 - Query Time: 0.55 ms After last query: 0.66 ms Query memory: 0.010 MB Memory before query: 30.834 MB Rows returned: 15
SELECT file.*
FROM `w0v41_eventgallery_file` AS file
WHERE file.folder='DSS97'
AND file.published=1
AND file.ismainimageonly=0
GROUP BY file.id
ORDER BY `ordering` ASC,ordering DESC, file.file
LIMIT 15id select_type table partitions type possible_keys key key_len ref rows filtered Extra 1 SIMPLE file NULL ref PRIMARY,file,index_file,index_folder file 377 const 24 1.00 Using where; Using filesort Status Duration starting 0.08 ms Executing hook on transaction 0.00 ms starting 0.01 ms checking permissions 0.01 ms Opening tables 0.04 ms init 0.00 ms System lock 0.01 ms optimizing 0.01 ms statistics 0.05 ms preparing 0.02 ms executing 0.19 ms end 0.01 ms query end 0.00 ms waiting for handler commit 0.01 ms closing tables 0.01 ms freeing items 0.05 ms cleaning up 0.01 ms # Caller File and line number 22 JDatabaseDriverMysqli->execute() JROOT/libraries/joomla/database/driver.php:1701 21 JDatabaseDriver->loadObjectList() JROOT/components/com_eventgallery/library/folder.php:549 20 EventgalleryLibraryFolder->getFiles() JROOT/plugins/content/eventgallery/eventgallery.php:187 19 PlgContentEventgallery->handleEventTag() JROOT/plugins/content/eventgallery/eventgallery.php:110 18 PlgContentEventgallery->replace() JROOT/plugins/content/eventgallery/eventgallery.php:103 17 PlgContentEventgallery->onContentPrepare() JROOT/libraries/joomla/event/event.php:70 16 JEvent->update() JROOT/libraries/joomla/event/dispatcher.php:160 15 JEventDispatcher->trigger() JROOT/modules/mod_k2_content/helper.php:472 14 modK2ContentHelper::getItems() JROOT/modules/mod_k2_content/mod_k2_content.php:65 13 include JROOT/modules/mod_k2_content/mod_k2_content.php JROOT/libraries/src/Helper/ModuleHelper.php:200 12 Joomla\CMS\Helper\ModuleHelper::renderModule() Same as call in the line below. 11 call_user_func_array() JROOT/libraries/src/Cache/Controller/CallbackController.php:173 10 Joomla\CMS\Cache\Controller\CallbackController->get() JROOT/libraries/src/Helper/ModuleHelper.php:617 9 Joomla\CMS\Helper\ModuleHelper::moduleCache() JROOT/libraries/src/Document/Renderer/Html/ModuleRenderer.php:95 8 Joomla\CMS\Document\Renderer\Html\ModuleRenderer->render() JROOT/libraries/src/Document/Renderer/Html/ModulesRenderer.php:47 7 Joomla\CMS\Document\Renderer\Html\ModulesRenderer->render() JROOT/libraries/src/Document/HtmlDocument.php:511 6 Joomla\CMS\Document\HtmlDocument->getBuffer() JROOT/libraries/src/Document/HtmlDocument.php:803 5 Joomla\CMS\Document\HtmlDocument->_renderTemplate() JROOT/libraries/src/Document/HtmlDocument.php:577 4 Joomla\CMS\Document\HtmlDocument->render() JROOT/libraries/src/Application/CMSApplication.php:1112 3 Joomla\CMS\Application\CMSApplication->render() JROOT/libraries/src/Application/SiteApplication.php:778 2 Joomla\CMS\Application\SiteApplication->render() JROOT/libraries/src/Application/CMSApplication.php:231 1 Joomla\CMS\Application\CMSApplication->execute() JROOT/index.php:49 - Query Time: 0.30 ms After last query: 0.11 ms Query memory: 0.011 MB Memory before query: 30.914 MB Rows returned: 1
SELECT *
FROM w0v41_eventgallery_file
WHERE folder='DSS97'
AND file='DSS97-06.jpg'id select_type table partitions type possible_keys key key_len ref rows filtered Extra 1 SIMPLE w0v41_eventgallery_file NULL const file,index_file,index_folder file 754 const,const 1 100.00 NULL Status Duration starting 0.07 ms Executing hook on transaction 0.00 ms starting 0.01 ms checking permissions 0.01 ms Opening tables 0.02 ms init 0.00 ms System lock 0.01 ms optimizing 0.01 ms statistics 0.03 ms preparing 0.01 ms executing 0.02 ms end 0.00 ms query end 0.00 ms waiting for handler commit 0.01 ms closing tables 0.01 ms freeing items 0.05 ms cleaning up 0.01 ms # Caller File and line number 25 JDatabaseDriverMysqli->execute() JROOT/libraries/joomla/database/driver.php:1662 24 JDatabaseDriver->loadObject() JROOT/components/com_eventgallery/library/factory/file/local.php:47 23 EventgalleryLibraryFactoryFileLocal->getFileDBData() JROOT/components/com_eventgallery/library/factory/file/local.php:28 22 EventgalleryLibraryFactoryFileLocal->getFile() JROOT/components/com_eventgallery/library/factory/file.php:44 21 EventgalleryLibraryFactoryFile->getFile() JROOT/components/com_eventgallery/library/folder.php:559 20 EventgalleryLibraryFolder->getFiles() JROOT/plugins/content/eventgallery/eventgallery.php:187 19 PlgContentEventgallery->handleEventTag() JROOT/plugins/content/eventgallery/eventgallery.php:110 18 PlgContentEventgallery->replace() JROOT/plugins/content/eventgallery/eventgallery.php:103 17 PlgContentEventgallery->onContentPrepare() JROOT/libraries/joomla/event/event.php:70 16 JEvent->update() JROOT/libraries/joomla/event/dispatcher.php:160 15 JEventDispatcher->trigger() JROOT/modules/mod_k2_content/helper.php:472 14 modK2ContentHelper::getItems() JROOT/modules/mod_k2_content/mod_k2_content.php:65 13 include JROOT/modules/mod_k2_content/mod_k2_content.php JROOT/libraries/src/Helper/ModuleHelper.php:200 12 Joomla\CMS\Helper\ModuleHelper::renderModule() Same as call in the line below. 11 call_user_func_array() JROOT/libraries/src/Cache/Controller/CallbackController.php:173 10 Joomla\CMS\Cache\Controller\CallbackController->get() JROOT/libraries/src/Helper/ModuleHelper.php:617 9 Joomla\CMS\Helper\ModuleHelper::moduleCache() JROOT/libraries/src/Document/Renderer/Html/ModuleRenderer.php:95 8 Joomla\CMS\Document\Renderer\Html\ModuleRenderer->render() JROOT/libraries/src/Document/Renderer/Html/ModulesRenderer.php:47 7 Joomla\CMS\Document\Renderer\Html\ModulesRenderer->render() JROOT/libraries/src/Document/HtmlDocument.php:511 6 Joomla\CMS\Document\HtmlDocument->getBuffer() JROOT/libraries/src/Document/HtmlDocument.php:803 5 Joomla\CMS\Document\HtmlDocument->_renderTemplate() JROOT/libraries/src/Document/HtmlDocument.php:577 4 Joomla\CMS\Document\HtmlDocument->render() JROOT/libraries/src/Application/CMSApplication.php:1112 3 Joomla\CMS\Application\CMSApplication->render() JROOT/libraries/src/Application/SiteApplication.php:778 2 Joomla\CMS\Application\SiteApplication->render() JROOT/libraries/src/Application/CMSApplication.php:231 1 Joomla\CMS\Application\CMSApplication->execute() JROOT/index.php:49 - Query Time: 0.27 ms After last query: 0.08 ms Query memory: 0.011 MB Memory before query: 30.931 MB Rows returned: 1
SELECT *
FROM w0v41_eventgallery_file
WHERE folder='DSS97'
AND file='DSS97-07.jpg'id select_type table partitions type possible_keys key key_len ref rows filtered Extra 1 SIMPLE w0v41_eventgallery_file NULL const file,index_file,index_folder file 754 const,const 1 100.00 NULL Status Duration starting 0.05 ms Executing hook on transaction 0.00 ms starting 0.01 ms checking permissions 0.00 ms Opening tables 0.02 ms init 0.01 ms System lock 0.01 ms optimizing 0.01 ms statistics 0.03 ms preparing 0.01 ms executing 0.02 ms end 0.00 ms query end 0.00 ms waiting for handler commit 0.01 ms closing tables 0.01 ms freeing items 0.04 ms cleaning up 0.01 ms # Caller File and line number 25 JDatabaseDriverMysqli->execute() JROOT/libraries/joomla/database/driver.php:1662 24 JDatabaseDriver->loadObject() JROOT/components/com_eventgallery/library/factory/file/local.php:47 23 EventgalleryLibraryFactoryFileLocal->getFileDBData() JROOT/components/com_eventgallery/library/factory/file/local.php:28 22 EventgalleryLibraryFactoryFileLocal->getFile() JROOT/components/com_eventgallery/library/factory/file.php:44 21 EventgalleryLibraryFactoryFile->getFile() JROOT/components/com_eventgallery/library/folder.php:559 20 EventgalleryLibraryFolder->getFiles() JROOT/plugins/content/eventgallery/eventgallery.php:187 19 PlgContentEventgallery->handleEventTag() JROOT/plugins/content/eventgallery/eventgallery.php:110 18 PlgContentEventgallery->replace() JROOT/plugins/content/eventgallery/eventgallery.php:103 17 PlgContentEventgallery->onContentPrepare() JROOT/libraries/joomla/event/event.php:70 16 JEvent->update() JROOT/libraries/joomla/event/dispatcher.php:160 15 JEventDispatcher->trigger() JROOT/modules/mod_k2_content/helper.php:472 14 modK2ContentHelper::getItems() JROOT/modules/mod_k2_content/mod_k2_content.php:65 13 include JROOT/modules/mod_k2_content/mod_k2_content.php JROOT/libraries/src/Helper/ModuleHelper.php:200 12 Joomla\CMS\Helper\ModuleHelper::renderModule() Same as call in the line below. 11 call_user_func_array() JROOT/libraries/src/Cache/Controller/CallbackController.php:173 10 Joomla\CMS\Cache\Controller\CallbackController->get() JROOT/libraries/src/Helper/ModuleHelper.php:617 9 Joomla\CMS\Helper\ModuleHelper::moduleCache() JROOT/libraries/src/Document/Renderer/Html/ModuleRenderer.php:95 8 Joomla\CMS\Document\Renderer\Html\ModuleRenderer->render() JROOT/libraries/src/Document/Renderer/Html/ModulesRenderer.php:47 7 Joomla\CMS\Document\Renderer\Html\ModulesRenderer->render() JROOT/libraries/src/Document/HtmlDocument.php:511 6 Joomla\CMS\Document\HtmlDocument->getBuffer() JROOT/libraries/src/Document/HtmlDocument.php:803 5 Joomla\CMS\Document\HtmlDocument->_renderTemplate() JROOT/libraries/src/Document/HtmlDocument.php:577 4 Joomla\CMS\Document\HtmlDocument->render() JROOT/libraries/src/Application/CMSApplication.php:1112 3 Joomla\CMS\Application\CMSApplication->render() JROOT/libraries/src/Application/SiteApplication.php:778 2 Joomla\CMS\Application\SiteApplication->render() JROOT/libraries/src/Application/CMSApplication.php:231 1 Joomla\CMS\Application\CMSApplication->execute() JROOT/index.php:49 - Query Time: 0.28 ms After last query: 0.07 ms Query memory: 0.011 MB Memory before query: 30.947 MB Rows returned: 1
SELECT *
FROM w0v41_eventgallery_file
WHERE folder='DSS97'
AND file='DSS97-08.jpg'id select_type table partitions type possible_keys key key_len ref rows filtered Extra 1 SIMPLE w0v41_eventgallery_file NULL const file,index_file,index_folder file 754 const,const 1 100.00 NULL Status Duration starting 0.06 ms Executing hook on transaction 0.00 ms starting 0.01 ms checking permissions 0.00 ms Opening tables 0.02 ms init 0.00 ms System lock 0.01 ms optimizing 0.01 ms statistics 0.03 ms preparing 0.01 ms executing 0.03 ms end 0.00 ms query end 0.00 ms waiting for handler commit 0.01 ms closing tables 0.01 ms freeing items 0.04 ms cleaning up 0.01 ms # Caller File and line number 25 JDatabaseDriverMysqli->execute() JROOT/libraries/joomla/database/driver.php:1662 24 JDatabaseDriver->loadObject() JROOT/components/com_eventgallery/library/factory/file/local.php:47 23 EventgalleryLibraryFactoryFileLocal->getFileDBData() JROOT/components/com_eventgallery/library/factory/file/local.php:28 22 EventgalleryLibraryFactoryFileLocal->getFile() JROOT/components/com_eventgallery/library/factory/file.php:44 21 EventgalleryLibraryFactoryFile->getFile() JROOT/components/com_eventgallery/library/folder.php:559 20 EventgalleryLibraryFolder->getFiles() JROOT/plugins/content/eventgallery/eventgallery.php:187 19 PlgContentEventgallery->handleEventTag() JROOT/plugins/content/eventgallery/eventgallery.php:110 18 PlgContentEventgallery->replace() JROOT/plugins/content/eventgallery/eventgallery.php:103 17 PlgContentEventgallery->onContentPrepare() JROOT/libraries/joomla/event/event.php:70 16 JEvent->update() JROOT/libraries/joomla/event/dispatcher.php:160 15 JEventDispatcher->trigger() JROOT/modules/mod_k2_content/helper.php:472 14 modK2ContentHelper::getItems() JROOT/modules/mod_k2_content/mod_k2_content.php:65 13 include JROOT/modules/mod_k2_content/mod_k2_content.php JROOT/libraries/src/Helper/ModuleHelper.php:200 12 Joomla\CMS\Helper\ModuleHelper::renderModule() Same as call in the line below. 11 call_user_func_array() JROOT/libraries/src/Cache/Controller/CallbackController.php:173 10 Joomla\CMS\Cache\Controller\CallbackController->get() JROOT/libraries/src/Helper/ModuleHelper.php:617 9 Joomla\CMS\Helper\ModuleHelper::moduleCache() JROOT/libraries/src/Document/Renderer/Html/ModuleRenderer.php:95 8 Joomla\CMS\Document\Renderer\Html\ModuleRenderer->render() JROOT/libraries/src/Document/Renderer/Html/ModulesRenderer.php:47 7 Joomla\CMS\Document\Renderer\Html\ModulesRenderer->render() JROOT/libraries/src/Document/HtmlDocument.php:511 6 Joomla\CMS\Document\HtmlDocument->getBuffer() JROOT/libraries/src/Document/HtmlDocument.php:803 5 Joomla\CMS\Document\HtmlDocument->_renderTemplate() JROOT/libraries/src/Document/HtmlDocument.php:577 4 Joomla\CMS\Document\HtmlDocument->render() JROOT/libraries/src/Application/CMSApplication.php:1112 3 Joomla\CMS\Application\CMSApplication->render() JROOT/libraries/src/Application/SiteApplication.php:778 2 Joomla\CMS\Application\SiteApplication->render() JROOT/libraries/src/Application/CMSApplication.php:231 1 Joomla\CMS\Application\CMSApplication->execute() JROOT/index.php:49 - Query Time: 0.28 ms After last query: 0.07 ms Query memory: 0.011 MB Memory before query: 30.963 MB Rows returned: 1
SELECT *
FROM w0v41_eventgallery_file
WHERE folder='DSS97'
AND file='DSS97-13.jpg'id select_type table partitions type possible_keys key key_len ref rows filtered Extra 1 SIMPLE w0v41_eventgallery_file NULL const file,index_file,index_folder file 754 const,const 1 100.00 NULL Status Duration starting 0.05 ms Executing hook on transaction 0.00 ms starting 0.01 ms checking permissions 0.00 ms Opening tables 0.02 ms init 0.00 ms System lock 0.01 ms optimizing 0.01 ms statistics 0.03 ms preparing 0.01 ms executing 0.02 ms end 0.01 ms query end 0.00 ms waiting for handler commit 0.01 ms closing tables 0.01 ms freeing items 0.04 ms cleaning up 0.01 ms # Caller File and line number 25 JDatabaseDriverMysqli->execute() JROOT/libraries/joomla/database/driver.php:1662 24 JDatabaseDriver->loadObject() JROOT/components/com_eventgallery/library/factory/file/local.php:47 23 EventgalleryLibraryFactoryFileLocal->getFileDBData() JROOT/components/com_eventgallery/library/factory/file/local.php:28 22 EventgalleryLibraryFactoryFileLocal->getFile() JROOT/components/com_eventgallery/library/factory/file.php:44 21 EventgalleryLibraryFactoryFile->getFile() JROOT/components/com_eventgallery/library/folder.php:559 20 EventgalleryLibraryFolder->getFiles() JROOT/plugins/content/eventgallery/eventgallery.php:187 19 PlgContentEventgallery->handleEventTag() JROOT/plugins/content/eventgallery/eventgallery.php:110 18 PlgContentEventgallery->replace() JROOT/plugins/content/eventgallery/eventgallery.php:103 17 PlgContentEventgallery->onContentPrepare() JROOT/libraries/joomla/event/event.php:70 16 JEvent->update() JROOT/libraries/joomla/event/dispatcher.php:160 15 JEventDispatcher->trigger() JROOT/modules/mod_k2_content/helper.php:472 14 modK2ContentHelper::getItems() JROOT/modules/mod_k2_content/mod_k2_content.php:65 13 include JROOT/modules/mod_k2_content/mod_k2_content.php JROOT/libraries/src/Helper/ModuleHelper.php:200 12 Joomla\CMS\Helper\ModuleHelper::renderModule() Same as call in the line below. 11 call_user_func_array() JROOT/libraries/src/Cache/Controller/CallbackController.php:173 10 Joomla\CMS\Cache\Controller\CallbackController->get() JROOT/libraries/src/Helper/ModuleHelper.php:617 9 Joomla\CMS\Helper\ModuleHelper::moduleCache() JROOT/libraries/src/Document/Renderer/Html/ModuleRenderer.php:95 8 Joomla\CMS\Document\Renderer\Html\ModuleRenderer->render() JROOT/libraries/src/Document/Renderer/Html/ModulesRenderer.php:47 7 Joomla\CMS\Document\Renderer\Html\ModulesRenderer->render() JROOT/libraries/src/Document/HtmlDocument.php:511 6 Joomla\CMS\Document\HtmlDocument->getBuffer() JROOT/libraries/src/Document/HtmlDocument.php:803 5 Joomla\CMS\Document\HtmlDocument->_renderTemplate() JROOT/libraries/src/Document/HtmlDocument.php:577 4 Joomla\CMS\Document\HtmlDocument->render() JROOT/libraries/src/Application/CMSApplication.php:1112 3 Joomla\CMS\Application\CMSApplication->render() JROOT/libraries/src/Application/SiteApplication.php:778 2 Joomla\CMS\Application\SiteApplication->render() JROOT/libraries/src/Application/CMSApplication.php:231 1 Joomla\CMS\Application\CMSApplication->execute() JROOT/index.php:49 - Query Time: 0.29 ms After last query: 0.07 ms Query memory: 0.011 MB Memory before query: 30.980 MB Rows returned: 1
SELECT *
FROM w0v41_eventgallery_file
WHERE folder='DSS97'
AND file='DSS97-15.jpg'id select_type table partitions type possible_keys key key_len ref rows filtered Extra 1 SIMPLE w0v41_eventgallery_file NULL const file,index_file,index_folder file 754 const,const 1 100.00 NULL Status Duration starting 0.07 ms Executing hook on transaction 0.00 ms starting 0.01 ms checking permissions 0.01 ms Opening tables 0.02 ms init 0.01 ms System lock 0.01 ms optimizing 0.01 ms statistics 0.03 ms preparing 0.01 ms executing 0.02 ms end 0.00 ms query end 0.00 ms waiting for handler commit 0.01 ms closing tables 0.01 ms freeing items 0.04 ms cleaning up 0.01 ms # Caller File and line number 25 JDatabaseDriverMysqli->execute() JROOT/libraries/joomla/database/driver.php:1662 24 JDatabaseDriver->loadObject() JROOT/components/com_eventgallery/library/factory/file/local.php:47 23 EventgalleryLibraryFactoryFileLocal->getFileDBData() JROOT/components/com_eventgallery/library/factory/file/local.php:28 22 EventgalleryLibraryFactoryFileLocal->getFile() JROOT/components/com_eventgallery/library/factory/file.php:44 21 EventgalleryLibraryFactoryFile->getFile() JROOT/components/com_eventgallery/library/folder.php:559 20 EventgalleryLibraryFolder->getFiles() JROOT/plugins/content/eventgallery/eventgallery.php:187 19 PlgContentEventgallery->handleEventTag() JROOT/plugins/content/eventgallery/eventgallery.php:110 18 PlgContentEventgallery->replace() JROOT/plugins/content/eventgallery/eventgallery.php:103 17 PlgContentEventgallery->onContentPrepare() JROOT/libraries/joomla/event/event.php:70 16 JEvent->update() JROOT/libraries/joomla/event/dispatcher.php:160 15 JEventDispatcher->trigger() JROOT/modules/mod_k2_content/helper.php:472 14 modK2ContentHelper::getItems() JROOT/modules/mod_k2_content/mod_k2_content.php:65 13 include JROOT/modules/mod_k2_content/mod_k2_content.php JROOT/libraries/src/Helper/ModuleHelper.php:200 12 Joomla\CMS\Helper\ModuleHelper::renderModule() Same as call in the line below. 11 call_user_func_array() JROOT/libraries/src/Cache/Controller/CallbackController.php:173 10 Joomla\CMS\Cache\Controller\CallbackController->get() JROOT/libraries/src/Helper/ModuleHelper.php:617 9 Joomla\CMS\Helper\ModuleHelper::moduleCache() JROOT/libraries/src/Document/Renderer/Html/ModuleRenderer.php:95 8 Joomla\CMS\Document\Renderer\Html\ModuleRenderer->render() JROOT/libraries/src/Document/Renderer/Html/ModulesRenderer.php:47 7 Joomla\CMS\Document\Renderer\Html\ModulesRenderer->render() JROOT/libraries/src/Document/HtmlDocument.php:511 6 Joomla\CMS\Document\HtmlDocument->getBuffer() JROOT/libraries/src/Document/HtmlDocument.php:803 5 Joomla\CMS\Document\HtmlDocument->_renderTemplate() JROOT/libraries/src/Document/HtmlDocument.php:577 4 Joomla\CMS\Document\HtmlDocument->render() JROOT/libraries/src/Application/CMSApplication.php:1112 3 Joomla\CMS\Application\CMSApplication->render() JROOT/libraries/src/Application/SiteApplication.php:778 2 Joomla\CMS\Application\SiteApplication->render() JROOT/libraries/src/Application/CMSApplication.php:231 1 Joomla\CMS\Application\CMSApplication->execute() JROOT/index.php:49 - Query Time: 0.28 ms After last query: 0.06 ms Query memory: 0.011 MB Memory before query: 30.996 MB Rows returned: 1
SELECT *
FROM w0v41_eventgallery_file
WHERE folder='DSS97'
AND file='DSS97-16.jpg'id select_type table partitions type possible_keys key key_len ref rows filtered Extra 1 SIMPLE w0v41_eventgallery_file NULL const file,index_file,index_folder file 754 const,const 1 100.00 NULL Status Duration starting 0.05 ms Executing hook on transaction 0.00 ms starting 0.01 ms checking permissions 0.00 ms Opening tables 0.02 ms init 0.01 ms System lock 0.01 ms optimizing 0.02 ms statistics 0.03 ms preparing 0.01 ms executing 0.02 ms end 0.00 ms query end 0.00 ms waiting for handler commit 0.01 ms closing tables 0.01 ms freeing items 0.04 ms cleaning up 0.01 ms # Caller File and line number 25 JDatabaseDriverMysqli->execute() JROOT/libraries/joomla/database/driver.php:1662 24 JDatabaseDriver->loadObject() JROOT/components/com_eventgallery/library/factory/file/local.php:47 23 EventgalleryLibraryFactoryFileLocal->getFileDBData() JROOT/components/com_eventgallery/library/factory/file/local.php:28 22 EventgalleryLibraryFactoryFileLocal->getFile() JROOT/components/com_eventgallery/library/factory/file.php:44 21 EventgalleryLibraryFactoryFile->getFile() JROOT/components/com_eventgallery/library/folder.php:559 20 EventgalleryLibraryFolder->getFiles() JROOT/plugins/content/eventgallery/eventgallery.php:187 19 PlgContentEventgallery->handleEventTag() JROOT/plugins/content/eventgallery/eventgallery.php:110 18 PlgContentEventgallery->replace() JROOT/plugins/content/eventgallery/eventgallery.php:103 17 PlgContentEventgallery->onContentPrepare() JROOT/libraries/joomla/event/event.php:70 16 JEvent->update() JROOT/libraries/joomla/event/dispatcher.php:160 15 JEventDispatcher->trigger() JROOT/modules/mod_k2_content/helper.php:472 14 modK2ContentHelper::getItems() JROOT/modules/mod_k2_content/mod_k2_content.php:65 13 include JROOT/modules/mod_k2_content/mod_k2_content.php JROOT/libraries/src/Helper/ModuleHelper.php:200 12 Joomla\CMS\Helper\ModuleHelper::renderModule() Same as call in the line below. 11 call_user_func_array() JROOT/libraries/src/Cache/Controller/CallbackController.php:173 10 Joomla\CMS\Cache\Controller\CallbackController->get() JROOT/libraries/src/Helper/ModuleHelper.php:617 9 Joomla\CMS\Helper\ModuleHelper::moduleCache() JROOT/libraries/src/Document/Renderer/Html/ModuleRenderer.php:95 8 Joomla\CMS\Document\Renderer\Html\ModuleRenderer->render() JROOT/libraries/src/Document/Renderer/Html/ModulesRenderer.php:47 7 Joomla\CMS\Document\Renderer\Html\ModulesRenderer->render() JROOT/libraries/src/Document/HtmlDocument.php:511 6 Joomla\CMS\Document\HtmlDocument->getBuffer() JROOT/libraries/src/Document/HtmlDocument.php:803 5 Joomla\CMS\Document\HtmlDocument->_renderTemplate() JROOT/libraries/src/Document/HtmlDocument.php:577 4 Joomla\CMS\Document\HtmlDocument->render() JROOT/libraries/src/Application/CMSApplication.php:1112 3 Joomla\CMS\Application\CMSApplication->render() JROOT/libraries/src/Application/SiteApplication.php:778 2 Joomla\CMS\Application\SiteApplication->render() JROOT/libraries/src/Application/CMSApplication.php:231 1 Joomla\CMS\Application\CMSApplication->execute() JROOT/index.php:49 - Query Time: 0.28 ms After last query: 0.07 ms Query memory: 0.011 MB Memory before query: 31.013 MB Rows returned: 1
SELECT *
FROM w0v41_eventgallery_file
WHERE folder='DSS97'
AND file='DSS97-17.jpg'id select_type table partitions type possible_keys key key_len ref rows filtered Extra 1 SIMPLE w0v41_eventgallery_file NULL const file,index_file,index_folder file 754 const,const 1 100.00 NULL Status Duration starting 0.05 ms Executing hook on transaction 0.00 ms starting 0.01 ms checking permissions 0.00 ms Opening tables 0.02 ms init 0.01 ms System lock 0.01 ms optimizing 0.01 ms statistics 0.03 ms preparing 0.01 ms executing 0.02 ms end 0.01 ms query end 0.00 ms waiting for handler commit 0.01 ms closing tables 0.01 ms freeing items 0.05 ms cleaning up 0.01 ms # Caller File and line number 25 JDatabaseDriverMysqli->execute() JROOT/libraries/joomla/database/driver.php:1662 24 JDatabaseDriver->loadObject() JROOT/components/com_eventgallery/library/factory/file/local.php:47 23 EventgalleryLibraryFactoryFileLocal->getFileDBData() JROOT/components/com_eventgallery/library/factory/file/local.php:28 22 EventgalleryLibraryFactoryFileLocal->getFile() JROOT/components/com_eventgallery/library/factory/file.php:44 21 EventgalleryLibraryFactoryFile->getFile() JROOT/components/com_eventgallery/library/folder.php:559 20 EventgalleryLibraryFolder->getFiles() JROOT/plugins/content/eventgallery/eventgallery.php:187 19 PlgContentEventgallery->handleEventTag() JROOT/plugins/content/eventgallery/eventgallery.php:110 18 PlgContentEventgallery->replace() JROOT/plugins/content/eventgallery/eventgallery.php:103 17 PlgContentEventgallery->onContentPrepare() JROOT/libraries/joomla/event/event.php:70 16 JEvent->update() JROOT/libraries/joomla/event/dispatcher.php:160 15 JEventDispatcher->trigger() JROOT/modules/mod_k2_content/helper.php:472 14 modK2ContentHelper::getItems() JROOT/modules/mod_k2_content/mod_k2_content.php:65 13 include JROOT/modules/mod_k2_content/mod_k2_content.php JROOT/libraries/src/Helper/ModuleHelper.php:200 12 Joomla\CMS\Helper\ModuleHelper::renderModule() Same as call in the line below. 11 call_user_func_array() JROOT/libraries/src/Cache/Controller/CallbackController.php:173 10 Joomla\CMS\Cache\Controller\CallbackController->get() JROOT/libraries/src/Helper/ModuleHelper.php:617 9 Joomla\CMS\Helper\ModuleHelper::moduleCache() JROOT/libraries/src/Document/Renderer/Html/ModuleRenderer.php:95 8 Joomla\CMS\Document\Renderer\Html\ModuleRenderer->render() JROOT/libraries/src/Document/Renderer/Html/ModulesRenderer.php:47 7 Joomla\CMS\Document\Renderer\Html\ModulesRenderer->render() JROOT/libraries/src/Document/HtmlDocument.php:511 6 Joomla\CMS\Document\HtmlDocument->getBuffer() JROOT/libraries/src/Document/HtmlDocument.php:803 5 Joomla\CMS\Document\HtmlDocument->_renderTemplate() JROOT/libraries/src/Document/HtmlDocument.php:577 4 Joomla\CMS\Document\HtmlDocument->render() JROOT/libraries/src/Application/CMSApplication.php:1112 3 Joomla\CMS\Application\CMSApplication->render() JROOT/libraries/src/Application/SiteApplication.php:778 2 Joomla\CMS\Application\SiteApplication->render() JROOT/libraries/src/Application/CMSApplication.php:231 1 Joomla\CMS\Application\CMSApplication->execute() JROOT/index.php:49 - Query Time: 0.27 ms After last query: 0.06 ms Query memory: 0.011 MB Memory before query: 31.029 MB Rows returned: 1
SELECT *
FROM w0v41_eventgallery_file
WHERE folder='DSS97'
AND file='DSS97-18.jpg'id select_type table partitions type possible_keys key key_len ref rows filtered Extra 1 SIMPLE w0v41_eventgallery_file NULL const file,index_file,index_folder file 754 const,const 1 100.00 NULL Status Duration starting 0.06 ms Executing hook on transaction 0.00 ms starting 0.01 ms checking permissions 0.00 ms Opening tables 0.02 ms init 0.01 ms System lock 0.01 ms optimizing 0.01 ms statistics 0.03 ms preparing 0.01 ms executing 0.02 ms end 0.01 ms query end 0.00 ms waiting for handler commit 0.01 ms closing tables 0.01 ms freeing items 0.04 ms cleaning up 0.01 ms # Caller File and line number 25 JDatabaseDriverMysqli->execute() JROOT/libraries/joomla/database/driver.php:1662 24 JDatabaseDriver->loadObject() JROOT/components/com_eventgallery/library/factory/file/local.php:47 23 EventgalleryLibraryFactoryFileLocal->getFileDBData() JROOT/components/com_eventgallery/library/factory/file/local.php:28 22 EventgalleryLibraryFactoryFileLocal->getFile() JROOT/components/com_eventgallery/library/factory/file.php:44 21 EventgalleryLibraryFactoryFile->getFile() JROOT/components/com_eventgallery/library/folder.php:559 20 EventgalleryLibraryFolder->getFiles() JROOT/plugins/content/eventgallery/eventgallery.php:187 19 PlgContentEventgallery->handleEventTag() JROOT/plugins/content/eventgallery/eventgallery.php:110 18 PlgContentEventgallery->replace() JROOT/plugins/content/eventgallery/eventgallery.php:103 17 PlgContentEventgallery->onContentPrepare() JROOT/libraries/joomla/event/event.php:70 16 JEvent->update() JROOT/libraries/joomla/event/dispatcher.php:160 15 JEventDispatcher->trigger() JROOT/modules/mod_k2_content/helper.php:472 14 modK2ContentHelper::getItems() JROOT/modules/mod_k2_content/mod_k2_content.php:65 13 include JROOT/modules/mod_k2_content/mod_k2_content.php JROOT/libraries/src/Helper/ModuleHelper.php:200 12 Joomla\CMS\Helper\ModuleHelper::renderModule() Same as call in the line below. 11 call_user_func_array() JROOT/libraries/src/Cache/Controller/CallbackController.php:173 10 Joomla\CMS\Cache\Controller\CallbackController->get() JROOT/libraries/src/Helper/ModuleHelper.php:617 9 Joomla\CMS\Helper\ModuleHelper::moduleCache() JROOT/libraries/src/Document/Renderer/Html/ModuleRenderer.php:95 8 Joomla\CMS\Document\Renderer\Html\ModuleRenderer->render() JROOT/libraries/src/Document/Renderer/Html/ModulesRenderer.php:47 7 Joomla\CMS\Document\Renderer\Html\ModulesRenderer->render() JROOT/libraries/src/Document/HtmlDocument.php:511 6 Joomla\CMS\Document\HtmlDocument->getBuffer() JROOT/libraries/src/Document/HtmlDocument.php:803 5 Joomla\CMS\Document\HtmlDocument->_renderTemplate() JROOT/libraries/src/Document/HtmlDocument.php:577 4 Joomla\CMS\Document\HtmlDocument->render() JROOT/libraries/src/Application/CMSApplication.php:1112 3 Joomla\CMS\Application\CMSApplication->render() JROOT/libraries/src/Application/SiteApplication.php:778 2 Joomla\CMS\Application\SiteApplication->render() JROOT/libraries/src/Application/CMSApplication.php:231 1 Joomla\CMS\Application\CMSApplication->execute() JROOT/index.php:49 - Query Time: 0.28 ms After last query: 0.06 ms Query memory: 0.011 MB Memory before query: 31.045 MB Rows returned: 1
SELECT *
FROM w0v41_eventgallery_file
WHERE folder='DSS97'
AND file='DSS97-22.jpg'id select_type table partitions type possible_keys key key_len ref rows filtered Extra 1 SIMPLE w0v41_eventgallery_file NULL const file,index_file,index_folder file 754 const,const 1 100.00 NULL Status Duration starting 0.06 ms Executing hook on transaction 0.01 ms starting 0.01 ms checking permissions 0.01 ms Opening tables 0.03 ms init 0.01 ms System lock 0.01 ms optimizing 0.01 ms statistics 0.03 ms preparing 0.01 ms executing 0.02 ms end 0.00 ms query end 0.00 ms waiting for handler commit 0.01 ms closing tables 0.01 ms freeing items 0.04 ms cleaning up 0.01 ms # Caller File and line number 25 JDatabaseDriverMysqli->execute() JROOT/libraries/joomla/database/driver.php:1662 24 JDatabaseDriver->loadObject() JROOT/components/com_eventgallery/library/factory/file/local.php:47 23 EventgalleryLibraryFactoryFileLocal->getFileDBData() JROOT/components/com_eventgallery/library/factory/file/local.php:28 22 EventgalleryLibraryFactoryFileLocal->getFile() JROOT/components/com_eventgallery/library/factory/file.php:44 21 EventgalleryLibraryFactoryFile->getFile() JROOT/components/com_eventgallery/library/folder.php:559 20 EventgalleryLibraryFolder->getFiles() JROOT/plugins/content/eventgallery/eventgallery.php:187 19 PlgContentEventgallery->handleEventTag() JROOT/plugins/content/eventgallery/eventgallery.php:110 18 PlgContentEventgallery->replace() JROOT/plugins/content/eventgallery/eventgallery.php:103 17 PlgContentEventgallery->onContentPrepare() JROOT/libraries/joomla/event/event.php:70 16 JEvent->update() JROOT/libraries/joomla/event/dispatcher.php:160 15 JEventDispatcher->trigger() JROOT/modules/mod_k2_content/helper.php:472 14 modK2ContentHelper::getItems() JROOT/modules/mod_k2_content/mod_k2_content.php:65 13 include JROOT/modules/mod_k2_content/mod_k2_content.php JROOT/libraries/src/Helper/ModuleHelper.php:200 12 Joomla\CMS\Helper\ModuleHelper::renderModule() Same as call in the line below. 11 call_user_func_array() JROOT/libraries/src/Cache/Controller/CallbackController.php:173 10 Joomla\CMS\Cache\Controller\CallbackController->get() JROOT/libraries/src/Helper/ModuleHelper.php:617 9 Joomla\CMS\Helper\ModuleHelper::moduleCache() JROOT/libraries/src/Document/Renderer/Html/ModuleRenderer.php:95 8 Joomla\CMS\Document\Renderer\Html\ModuleRenderer->render() JROOT/libraries/src/Document/Renderer/Html/ModulesRenderer.php:47 7 Joomla\CMS\Document\Renderer\Html\ModulesRenderer->render() JROOT/libraries/src/Document/HtmlDocument.php:511 6 Joomla\CMS\Document\HtmlDocument->getBuffer() JROOT/libraries/src/Document/HtmlDocument.php:803 5 Joomla\CMS\Document\HtmlDocument->_renderTemplate() JROOT/libraries/src/Document/HtmlDocument.php:577 4 Joomla\CMS\Document\HtmlDocument->render() JROOT/libraries/src/Application/CMSApplication.php:1112 3 Joomla\CMS\Application\CMSApplication->render() JROOT/libraries/src/Application/SiteApplication.php:778 2 Joomla\CMS\Application\SiteApplication->render() JROOT/libraries/src/Application/CMSApplication.php:231 1 Joomla\CMS\Application\CMSApplication->execute() JROOT/index.php:49 - Query Time: 0.27 ms After last query: 0.07 ms Query memory: 0.011 MB Memory before query: 31.062 MB Rows returned: 1
SELECT *
FROM w0v41_eventgallery_file
WHERE folder='DSS97'
AND file='DSS97-26.jpg'id select_type table partitions type possible_keys key key_len ref rows filtered Extra 1 SIMPLE w0v41_eventgallery_file NULL const file,index_file,index_folder file 754 const,const 1 100.00 NULL Status Duration starting 0.05 ms Executing hook on transaction 0.00 ms starting 0.01 ms checking permissions 0.00 ms Opening tables 0.02 ms init 0.00 ms System lock 0.01 ms optimizing 0.01 ms statistics 0.03 ms preparing 0.01 ms executing 0.02 ms end 0.00 ms query end 0.00 ms waiting for handler commit 0.01 ms closing tables 0.01 ms freeing items 0.04 ms cleaning up 0.01 ms # Caller File and line number 25 JDatabaseDriverMysqli->execute() JROOT/libraries/joomla/database/driver.php:1662 24 JDatabaseDriver->loadObject() JROOT/components/com_eventgallery/library/factory/file/local.php:47 23 EventgalleryLibraryFactoryFileLocal->getFileDBData() JROOT/components/com_eventgallery/library/factory/file/local.php:28 22 EventgalleryLibraryFactoryFileLocal->getFile() JROOT/components/com_eventgallery/library/factory/file.php:44 21 EventgalleryLibraryFactoryFile->getFile() JROOT/components/com_eventgallery/library/folder.php:559 20 EventgalleryLibraryFolder->getFiles() JROOT/plugins/content/eventgallery/eventgallery.php:187 19 PlgContentEventgallery->handleEventTag() JROOT/plugins/content/eventgallery/eventgallery.php:110 18 PlgContentEventgallery->replace() JROOT/plugins/content/eventgallery/eventgallery.php:103 17 PlgContentEventgallery->onContentPrepare() JROOT/libraries/joomla/event/event.php:70 16 JEvent->update() JROOT/libraries/joomla/event/dispatcher.php:160 15 JEventDispatcher->trigger() JROOT/modules/mod_k2_content/helper.php:472 14 modK2ContentHelper::getItems() JROOT/modules/mod_k2_content/mod_k2_content.php:65 13 include JROOT/modules/mod_k2_content/mod_k2_content.php JROOT/libraries/src/Helper/ModuleHelper.php:200 12 Joomla\CMS\Helper\ModuleHelper::renderModule() Same as call in the line below. 11 call_user_func_array() JROOT/libraries/src/Cache/Controller/CallbackController.php:173 10 Joomla\CMS\Cache\Controller\CallbackController->get() JROOT/libraries/src/Helper/ModuleHelper.php:617 9 Joomla\CMS\Helper\ModuleHelper::moduleCache() JROOT/libraries/src/Document/Renderer/Html/ModuleRenderer.php:95 8 Joomla\CMS\Document\Renderer\Html\ModuleRenderer->render() JROOT/libraries/src/Document/Renderer/Html/ModulesRenderer.php:47 7 Joomla\CMS\Document\Renderer\Html\ModulesRenderer->render() JROOT/libraries/src/Document/HtmlDocument.php:511 6 Joomla\CMS\Document\HtmlDocument->getBuffer() JROOT/libraries/src/Document/HtmlDocument.php:803 5 Joomla\CMS\Document\HtmlDocument->_renderTemplate() JROOT/libraries/src/Document/HtmlDocument.php:577 4 Joomla\CMS\Document\HtmlDocument->render() JROOT/libraries/src/Application/CMSApplication.php:1112 3 Joomla\CMS\Application\CMSApplication->render() JROOT/libraries/src/Application/SiteApplication.php:778 2 Joomla\CMS\Application\SiteApplication->render() JROOT/libraries/src/Application/CMSApplication.php:231 1 Joomla\CMS\Application\CMSApplication->execute() JROOT/index.php:49 - Query Time: 0.27 ms After last query: 0.06 ms Query memory: 0.011 MB Memory before query: 31.079 MB Rows returned: 1
SELECT *
FROM w0v41_eventgallery_file
WHERE folder='DSS97'
AND file='DSS97-27.jpg'id select_type table partitions type possible_keys key key_len ref rows filtered Extra 1 SIMPLE w0v41_eventgallery_file NULL const file,index_file,index_folder file 754 const,const 1 100.00 NULL Status Duration starting 0.05 ms Executing hook on transaction 0.00 ms starting 0.01 ms checking permissions 0.01 ms Opening tables 0.02 ms init 0.00 ms System lock 0.01 ms optimizing 0.01 ms statistics 0.03 ms preparing 0.01 ms executing 0.02 ms end 0.00 ms query end 0.00 ms waiting for handler commit 0.01 ms closing tables 0.01 ms freeing items 0.05 ms cleaning up 0.01 ms # Caller File and line number 25 JDatabaseDriverMysqli->execute() JROOT/libraries/joomla/database/driver.php:1662 24 JDatabaseDriver->loadObject() JROOT/components/com_eventgallery/library/factory/file/local.php:47 23 EventgalleryLibraryFactoryFileLocal->getFileDBData() JROOT/components/com_eventgallery/library/factory/file/local.php:28 22 EventgalleryLibraryFactoryFileLocal->getFile() JROOT/components/com_eventgallery/library/factory/file.php:44 21 EventgalleryLibraryFactoryFile->getFile() JROOT/components/com_eventgallery/library/folder.php:559 20 EventgalleryLibraryFolder->getFiles() JROOT/plugins/content/eventgallery/eventgallery.php:187 19 PlgContentEventgallery->handleEventTag() JROOT/plugins/content/eventgallery/eventgallery.php:110 18 PlgContentEventgallery->replace() JROOT/plugins/content/eventgallery/eventgallery.php:103 17 PlgContentEventgallery->onContentPrepare() JROOT/libraries/joomla/event/event.php:70 16 JEvent->update() JROOT/libraries/joomla/event/dispatcher.php:160 15 JEventDispatcher->trigger() JROOT/modules/mod_k2_content/helper.php:472 14 modK2ContentHelper::getItems() JROOT/modules/mod_k2_content/mod_k2_content.php:65 13 include JROOT/modules/mod_k2_content/mod_k2_content.php JROOT/libraries/src/Helper/ModuleHelper.php:200 12 Joomla\CMS\Helper\ModuleHelper::renderModule() Same as call in the line below. 11 call_user_func_array() JROOT/libraries/src/Cache/Controller/CallbackController.php:173 10 Joomla\CMS\Cache\Controller\CallbackController->get() JROOT/libraries/src/Helper/ModuleHelper.php:617 9 Joomla\CMS\Helper\ModuleHelper::moduleCache() JROOT/libraries/src/Document/Renderer/Html/ModuleRenderer.php:95 8 Joomla\CMS\Document\Renderer\Html\ModuleRenderer->render() JROOT/libraries/src/Document/Renderer/Html/ModulesRenderer.php:47 7 Joomla\CMS\Document\Renderer\Html\ModulesRenderer->render() JROOT/libraries/src/Document/HtmlDocument.php:511 6 Joomla\CMS\Document\HtmlDocument->getBuffer() JROOT/libraries/src/Document/HtmlDocument.php:803 5 Joomla\CMS\Document\HtmlDocument->_renderTemplate() JROOT/libraries/src/Document/HtmlDocument.php:577 4 Joomla\CMS\Document\HtmlDocument->render() JROOT/libraries/src/Application/CMSApplication.php:1112 3 Joomla\CMS\Application\CMSApplication->render() JROOT/libraries/src/Application/SiteApplication.php:778 2 Joomla\CMS\Application\SiteApplication->render() JROOT/libraries/src/Application/CMSApplication.php:231 1 Joomla\CMS\Application\CMSApplication->execute() JROOT/index.php:49 - Query Time: 0.28 ms After last query: 0.07 ms Query memory: 0.011 MB Memory before query: 31.095 MB Rows returned: 1
SELECT *
FROM w0v41_eventgallery_file
WHERE folder='DSS97'
AND file='DSS97-28.jpg'id select_type table partitions type possible_keys key key_len ref rows filtered Extra 1 SIMPLE w0v41_eventgallery_file NULL const file,index_file,index_folder file 754 const,const 1 100.00 NULL Status Duration starting 0.06 ms Executing hook on transaction 0.01 ms starting 0.01 ms checking permissions 0.01 ms Opening tables 0.02 ms init 0.01 ms System lock 0.01 ms optimizing 0.01 ms statistics 0.03 ms preparing 0.01 ms executing 0.02 ms end 0.00 ms query end 0.00 ms waiting for handler commit 0.01 ms closing tables 0.01 ms freeing items 0.04 ms cleaning up 0.01 ms # Caller File and line number 25 JDatabaseDriverMysqli->execute() JROOT/libraries/joomla/database/driver.php:1662 24 JDatabaseDriver->loadObject() JROOT/components/com_eventgallery/library/factory/file/local.php:47 23 EventgalleryLibraryFactoryFileLocal->getFileDBData() JROOT/components/com_eventgallery/library/factory/file/local.php:28 22 EventgalleryLibraryFactoryFileLocal->getFile() JROOT/components/com_eventgallery/library/factory/file.php:44 21 EventgalleryLibraryFactoryFile->getFile() JROOT/components/com_eventgallery/library/folder.php:559 20 EventgalleryLibraryFolder->getFiles() JROOT/plugins/content/eventgallery/eventgallery.php:187 19 PlgContentEventgallery->handleEventTag() JROOT/plugins/content/eventgallery/eventgallery.php:110 18 PlgContentEventgallery->replace() JROOT/plugins/content/eventgallery/eventgallery.php:103 17 PlgContentEventgallery->onContentPrepare() JROOT/libraries/joomla/event/event.php:70 16 JEvent->update() JROOT/libraries/joomla/event/dispatcher.php:160 15 JEventDispatcher->trigger() JROOT/modules/mod_k2_content/helper.php:472 14 modK2ContentHelper::getItems() JROOT/modules/mod_k2_content/mod_k2_content.php:65 13 include JROOT/modules/mod_k2_content/mod_k2_content.php JROOT/libraries/src/Helper/ModuleHelper.php:200 12 Joomla\CMS\Helper\ModuleHelper::renderModule() Same as call in the line below. 11 call_user_func_array() JROOT/libraries/src/Cache/Controller/CallbackController.php:173 10 Joomla\CMS\Cache\Controller\CallbackController->get() JROOT/libraries/src/Helper/ModuleHelper.php:617 9 Joomla\CMS\Helper\ModuleHelper::moduleCache() JROOT/libraries/src/Document/Renderer/Html/ModuleRenderer.php:95 8 Joomla\CMS\Document\Renderer\Html\ModuleRenderer->render() JROOT/libraries/src/Document/Renderer/Html/ModulesRenderer.php:47 7 Joomla\CMS\Document\Renderer\Html\ModulesRenderer->render() JROOT/libraries/src/Document/HtmlDocument.php:511 6 Joomla\CMS\Document\HtmlDocument->getBuffer() JROOT/libraries/src/Document/HtmlDocument.php:803 5 Joomla\CMS\Document\HtmlDocument->_renderTemplate() JROOT/libraries/src/Document/HtmlDocument.php:577 4 Joomla\CMS\Document\HtmlDocument->render() JROOT/libraries/src/Application/CMSApplication.php:1112 3 Joomla\CMS\Application\CMSApplication->render() JROOT/libraries/src/Application/SiteApplication.php:778 2 Joomla\CMS\Application\SiteApplication->render() JROOT/libraries/src/Application/CMSApplication.php:231 1 Joomla\CMS\Application\CMSApplication->execute() JROOT/index.php:49 - Query Time: 0.27 ms After last query: 0.07 ms Query memory: 0.011 MB Memory before query: 31.111 MB Rows returned: 1
SELECT *
FROM w0v41_eventgallery_file
WHERE folder='DSS97'
AND file='DSS97-31.jpg'id select_type table partitions type possible_keys key key_len ref rows filtered Extra 1 SIMPLE w0v41_eventgallery_file NULL const file,index_file,index_folder file 754 const,const 1 100.00 NULL Status Duration starting 0.06 ms Executing hook on transaction 0.00 ms starting 0.00 ms checking permissions 0.01 ms Opening tables 0.02 ms init 0.00 ms System lock 0.01 ms optimizing 0.01 ms statistics 0.03 ms preparing 0.01 ms executing 0.02 ms end 0.00 ms query end 0.00 ms waiting for handler commit 0.01 ms closing tables 0.01 ms freeing items 0.04 ms cleaning up 0.01 ms # Caller File and line number 25 JDatabaseDriverMysqli->execute() JROOT/libraries/joomla/database/driver.php:1662 24 JDatabaseDriver->loadObject() JROOT/components/com_eventgallery/library/factory/file/local.php:47 23 EventgalleryLibraryFactoryFileLocal->getFileDBData() JROOT/components/com_eventgallery/library/factory/file/local.php:28 22 EventgalleryLibraryFactoryFileLocal->getFile() JROOT/components/com_eventgallery/library/factory/file.php:44 21 EventgalleryLibraryFactoryFile->getFile() JROOT/components/com_eventgallery/library/folder.php:559 20 EventgalleryLibraryFolder->getFiles() JROOT/plugins/content/eventgallery/eventgallery.php:187 19 PlgContentEventgallery->handleEventTag() JROOT/plugins/content/eventgallery/eventgallery.php:110 18 PlgContentEventgallery->replace() JROOT/plugins/content/eventgallery/eventgallery.php:103 17 PlgContentEventgallery->onContentPrepare() JROOT/libraries/joomla/event/event.php:70 16 JEvent->update() JROOT/libraries/joomla/event/dispatcher.php:160 15 JEventDispatcher->trigger() JROOT/modules/mod_k2_content/helper.php:472 14 modK2ContentHelper::getItems() JROOT/modules/mod_k2_content/mod_k2_content.php:65 13 include JROOT/modules/mod_k2_content/mod_k2_content.php JROOT/libraries/src/Helper/ModuleHelper.php:200 12 Joomla\CMS\Helper\ModuleHelper::renderModule() Same as call in the line below. 11 call_user_func_array() JROOT/libraries/src/Cache/Controller/CallbackController.php:173 10 Joomla\CMS\Cache\Controller\CallbackController->get() JROOT/libraries/src/Helper/ModuleHelper.php:617 9 Joomla\CMS\Helper\ModuleHelper::moduleCache() JROOT/libraries/src/Document/Renderer/Html/ModuleRenderer.php:95 8 Joomla\CMS\Document\Renderer\Html\ModuleRenderer->render() JROOT/libraries/src/Document/Renderer/Html/ModulesRenderer.php:47 7 Joomla\CMS\Document\Renderer\Html\ModulesRenderer->render() JROOT/libraries/src/Document/HtmlDocument.php:511 6 Joomla\CMS\Document\HtmlDocument->getBuffer() JROOT/libraries/src/Document/HtmlDocument.php:803 5 Joomla\CMS\Document\HtmlDocument->_renderTemplate() JROOT/libraries/src/Document/HtmlDocument.php:577 4 Joomla\CMS\Document\HtmlDocument->render() JROOT/libraries/src/Application/CMSApplication.php:1112 3 Joomla\CMS\Application\CMSApplication->render() JROOT/libraries/src/Application/SiteApplication.php:778 2 Joomla\CMS\Application\SiteApplication->render() JROOT/libraries/src/Application/CMSApplication.php:231 1 Joomla\CMS\Application\CMSApplication->execute() JROOT/index.php:49 - Query Time: 0.29 ms After last query: 0.06 ms Query memory: 0.011 MB Memory before query: 31.128 MB Rows returned: 1
SELECT *
FROM w0v41_eventgallery_file
WHERE folder='DSS97'
AND file='DSS97-33.jpg'id select_type table partitions type possible_keys key key_len ref rows filtered Extra 1 SIMPLE w0v41_eventgallery_file NULL const file,index_file,index_folder file 754 const,const 1 100.00 NULL Status Duration starting 0.05 ms Executing hook on transaction 0.00 ms starting 0.01 ms checking permissions 0.00 ms Opening tables 0.03 ms init 0.01 ms System lock 0.01 ms optimizing 0.01 ms statistics 0.03 ms preparing 0.01 ms executing 0.03 ms end 0.01 ms query end 0.00 ms waiting for handler commit 0.01 ms closing tables 0.01 ms freeing items 0.04 ms cleaning up 0.01 ms # Caller File and line number 25 JDatabaseDriverMysqli->execute() JROOT/libraries/joomla/database/driver.php:1662 24 JDatabaseDriver->loadObject() JROOT/components/com_eventgallery/library/factory/file/local.php:47 23 EventgalleryLibraryFactoryFileLocal->getFileDBData() JROOT/components/com_eventgallery/library/factory/file/local.php:28 22 EventgalleryLibraryFactoryFileLocal->getFile() JROOT/components/com_eventgallery/library/factory/file.php:44 21 EventgalleryLibraryFactoryFile->getFile() JROOT/components/com_eventgallery/library/folder.php:559 20 EventgalleryLibraryFolder->getFiles() JROOT/plugins/content/eventgallery/eventgallery.php:187 19 PlgContentEventgallery->handleEventTag() JROOT/plugins/content/eventgallery/eventgallery.php:110 18 PlgContentEventgallery->replace() JROOT/plugins/content/eventgallery/eventgallery.php:103 17 PlgContentEventgallery->onContentPrepare() JROOT/libraries/joomla/event/event.php:70 16 JEvent->update() JROOT/libraries/joomla/event/dispatcher.php:160 15 JEventDispatcher->trigger() JROOT/modules/mod_k2_content/helper.php:472 14 modK2ContentHelper::getItems() JROOT/modules/mod_k2_content/mod_k2_content.php:65 13 include JROOT/modules/mod_k2_content/mod_k2_content.php JROOT/libraries/src/Helper/ModuleHelper.php:200 12 Joomla\CMS\Helper\ModuleHelper::renderModule() Same as call in the line below. 11 call_user_func_array() JROOT/libraries/src/Cache/Controller/CallbackController.php:173 10 Joomla\CMS\Cache\Controller\CallbackController->get() JROOT/libraries/src/Helper/ModuleHelper.php:617 9 Joomla\CMS\Helper\ModuleHelper::moduleCache() JROOT/libraries/src/Document/Renderer/Html/ModuleRenderer.php:95 8 Joomla\CMS\Document\Renderer\Html\ModuleRenderer->render() JROOT/libraries/src/Document/Renderer/Html/ModulesRenderer.php:47 7 Joomla\CMS\Document\Renderer\Html\ModulesRenderer->render() JROOT/libraries/src/Document/HtmlDocument.php:511 6 Joomla\CMS\Document\HtmlDocument->getBuffer() JROOT/libraries/src/Document/HtmlDocument.php:803 5 Joomla\CMS\Document\HtmlDocument->_renderTemplate() JROOT/libraries/src/Document/HtmlDocument.php:577 4 Joomla\CMS\Document\HtmlDocument->render() JROOT/libraries/src/Application/CMSApplication.php:1112 3 Joomla\CMS\Application\CMSApplication->render() JROOT/libraries/src/Application/SiteApplication.php:778 2 Joomla\CMS\Application\SiteApplication->render() JROOT/libraries/src/Application/CMSApplication.php:231 1 Joomla\CMS\Application\CMSApplication->execute() JROOT/index.php:49 - Query Time: 0.28 ms After last query: 0.07 ms Query memory: 0.011 MB Memory before query: 31.144 MB Rows returned: 1
SELECT *
FROM w0v41_eventgallery_file
WHERE folder='DSS97'
AND file='DSS97-36.jpg'id select_type table partitions type possible_keys key key_len ref rows filtered Extra 1 SIMPLE w0v41_eventgallery_file NULL const file,index_file,index_folder file 754 const,const 1 100.00 NULL Status Duration starting 0.07 ms Executing hook on transaction 0.00 ms starting 0.01 ms checking permissions 0.00 ms Opening tables 0.02 ms init 0.00 ms System lock 0.01 ms optimizing 0.01 ms statistics 0.03 ms preparing 0.01 ms executing 0.02 ms end 0.00 ms query end 0.00 ms waiting for handler commit 0.01 ms closing tables 0.01 ms freeing items 0.04 ms cleaning up 0.01 ms # Caller File and line number 25 JDatabaseDriverMysqli->execute() JROOT/libraries/joomla/database/driver.php:1662 24 JDatabaseDriver->loadObject() JROOT/components/com_eventgallery/library/factory/file/local.php:47 23 EventgalleryLibraryFactoryFileLocal->getFileDBData() JROOT/components/com_eventgallery/library/factory/file/local.php:28 22 EventgalleryLibraryFactoryFileLocal->getFile() JROOT/components/com_eventgallery/library/factory/file.php:44 21 EventgalleryLibraryFactoryFile->getFile() JROOT/components/com_eventgallery/library/folder.php:559 20 EventgalleryLibraryFolder->getFiles() JROOT/plugins/content/eventgallery/eventgallery.php:187 19 PlgContentEventgallery->handleEventTag() JROOT/plugins/content/eventgallery/eventgallery.php:110 18 PlgContentEventgallery->replace() JROOT/plugins/content/eventgallery/eventgallery.php:103 17 PlgContentEventgallery->onContentPrepare() JROOT/libraries/joomla/event/event.php:70 16 JEvent->update() JROOT/libraries/joomla/event/dispatcher.php:160 15 JEventDispatcher->trigger() JROOT/modules/mod_k2_content/helper.php:472 14 modK2ContentHelper::getItems() JROOT/modules/mod_k2_content/mod_k2_content.php:65 13 include JROOT/modules/mod_k2_content/mod_k2_content.php JROOT/libraries/src/Helper/ModuleHelper.php:200 12 Joomla\CMS\Helper\ModuleHelper::renderModule() Same as call in the line below. 11 call_user_func_array() JROOT/libraries/src/Cache/Controller/CallbackController.php:173 10 Joomla\CMS\Cache\Controller\CallbackController->get() JROOT/libraries/src/Helper/ModuleHelper.php:617 9 Joomla\CMS\Helper\ModuleHelper::moduleCache() JROOT/libraries/src/Document/Renderer/Html/ModuleRenderer.php:95 8 Joomla\CMS\Document\Renderer\Html\ModuleRenderer->render() JROOT/libraries/src/Document/Renderer/Html/ModulesRenderer.php:47 7 Joomla\CMS\Document\Renderer\Html\ModulesRenderer->render() JROOT/libraries/src/Document/HtmlDocument.php:511 6 Joomla\CMS\Document\HtmlDocument->getBuffer() JROOT/libraries/src/Document/HtmlDocument.php:803 5 Joomla\CMS\Document\HtmlDocument->_renderTemplate() JROOT/libraries/src/Document/HtmlDocument.php:577 4 Joomla\CMS\Document\HtmlDocument->render() JROOT/libraries/src/Application/CMSApplication.php:1112 3 Joomla\CMS\Application\CMSApplication->render() JROOT/libraries/src/Application/SiteApplication.php:778 2 Joomla\CMS\Application\SiteApplication->render() JROOT/libraries/src/Application/CMSApplication.php:231 1 Joomla\CMS\Application\CMSApplication->execute() JROOT/index.php:49 - Query Time: 0.45 ms After last query: 0.60 ms Query memory: 0.011 MB Memory before query: 31.120 MB Rows returned: 4
SELECT `m`.`tag_id`,`t`.*
FROM `w0v41_contentitem_tag_map` AS m
INNER JOIN `w0v41_tags` AS t
ON `m`.`tag_id` = `t`.`id`
WHERE `m`.`type_alias` = 'com_eventgallery.event'
AND `m`.`content_item_id` = 3
AND `t`.`published` = 1
AND t.access IN (1,1,5)id select_type table partitions type possible_keys key key_len ref rows filtered Extra 1 SIMPLE m NULL ALL idx_tag_type NO INDEX KEY COULD BE USED NULL NULL 23 4.35 Using where 1 SIMPLE t NULL eq_ref PRIMARY,tag_idx,idx_access PRIMARY 4 h88876_SDAT.m.tag_id 1 100.00 Using where Status Duration starting 0.08 ms Executing hook on transaction 0.00 ms starting 0.01 ms checking permissions 0.00 ms checking permissions 0.00 ms Opening tables 0.06 ms init 0.01 ms System lock 0.01 ms optimizing 0.01 ms statistics 0.07 ms preparing 0.02 ms executing 0.07 ms end 0.00 ms query end 0.00 ms waiting for handler commit 0.01 ms closing tables 0.01 ms freeing items 0.05 ms cleaning up 0.01 ms # Caller File and line number 25 JDatabaseDriverMysqli->execute() JROOT/libraries/joomla/database/driver.php:1701 24 JDatabaseDriver->loadObjectList() JROOT/libraries/src/Helper/TagsHelper.php:454 23 Joomla\CMS\Helper\TagsHelper->getItemTags() JROOT/components/com_eventgallery/library/factory/tags.php:30 22 EventgalleryLibraryFactoryTags->getTagsForFolderId() JROOT/components/com_eventgallery/library/folder.php:590 21 EventgalleryLibraryFolder->getTags() JROOT/plugins/content/eventgallery/tmpl/event.php:15 20 include JROOT/plugins/content/eventgallery/tmpl/event.php JROOT/plugins/content/eventgallery/eventgallery.php:198 19 PlgContentEventgallery->handleEventTag() JROOT/plugins/content/eventgallery/eventgallery.php:110 18 PlgContentEventgallery->replace() JROOT/plugins/content/eventgallery/eventgallery.php:103 17 PlgContentEventgallery->onContentPrepare() JROOT/libraries/joomla/event/event.php:70 16 JEvent->update() JROOT/libraries/joomla/event/dispatcher.php:160 15 JEventDispatcher->trigger() JROOT/modules/mod_k2_content/helper.php:472 14 modK2ContentHelper::getItems() JROOT/modules/mod_k2_content/mod_k2_content.php:65 13 include JROOT/modules/mod_k2_content/mod_k2_content.php JROOT/libraries/src/Helper/ModuleHelper.php:200 12 Joomla\CMS\Helper\ModuleHelper::renderModule() Same as call in the line below. 11 call_user_func_array() JROOT/libraries/src/Cache/Controller/CallbackController.php:173 10 Joomla\CMS\Cache\Controller\CallbackController->get() JROOT/libraries/src/Helper/ModuleHelper.php:617 9 Joomla\CMS\Helper\ModuleHelper::moduleCache() JROOT/libraries/src/Document/Renderer/Html/ModuleRenderer.php:95 8 Joomla\CMS\Document\Renderer\Html\ModuleRenderer->render() JROOT/libraries/src/Document/Renderer/Html/ModulesRenderer.php:47 7 Joomla\CMS\Document\Renderer\Html\ModulesRenderer->render() JROOT/libraries/src/Document/HtmlDocument.php:511 6 Joomla\CMS\Document\HtmlDocument->getBuffer() JROOT/libraries/src/Document/HtmlDocument.php:803 5 Joomla\CMS\Document\HtmlDocument->_renderTemplate() JROOT/libraries/src/Document/HtmlDocument.php:577 4 Joomla\CMS\Document\HtmlDocument->render() JROOT/libraries/src/Application/CMSApplication.php:1112 3 Joomla\CMS\Application\CMSApplication->render() JROOT/libraries/src/Application/SiteApplication.php:778 2 Joomla\CMS\Application\SiteApplication->render() JROOT/libraries/src/Application/CMSApplication.php:231 1 Joomla\CMS\Application\CMSApplication->execute() JROOT/index.php:49 - Query Time: 0.46 ms After last query: 29.63 ms Query memory: 0.009 MB Memory before query: 31.129 MB Rows returned: 1
SELECT enabled
FROM w0v41_extensions
WHERE element = 'com_sppagebuilder'
AND type = 'component'id select_type table partitions type possible_keys key key_len ref rows filtered Extra 1 SIMPLE w0v41_extensions NULL ref element_clientid,element_folder_clientid,extension element_clientid 402 const 1 10.00 Using where Status Duration starting 0.13 ms Executing hook on transaction 0.01 ms starting 0.01 ms checking permissions 0.01 ms Opening tables 0.03 ms init 0.01 ms System lock 0.01 ms optimizing 0.01 ms statistics 0.08 ms preparing 0.02 ms executing 0.04 ms end 0.01 ms query end 0.00 ms waiting for handler commit 0.01 ms closing tables 0.01 ms freeing items 0.05 ms cleaning up 0.01 ms # Caller File and line number 20 JDatabaseDriverMysqli->execute() JROOT/libraries/joomla/database/driver.php:1740 19 JDatabaseDriver->loadResult() JROOT/plugins/k2/sppagebuilder/sppagebuilder.php:99 18 plgK2Sppagebuilder->isSppagebuilderEnabled() JROOT/plugins/k2/sppagebuilder/sppagebuilder.php:84 17 plgK2Sppagebuilder->onK2PrepareContent() JROOT/libraries/joomla/event/event.php:70 16 JEvent->update() JROOT/libraries/joomla/event/dispatcher.php:160 15 JEventDispatcher->trigger() JROOT/modules/mod_k2_content/helper.php:518 14 modK2ContentHelper::getItems() JROOT/modules/mod_k2_content/mod_k2_content.php:65 13 include JROOT/modules/mod_k2_content/mod_k2_content.php JROOT/libraries/src/Helper/ModuleHelper.php:200 12 Joomla\CMS\Helper\ModuleHelper::renderModule() Same as call in the line below. 11 call_user_func_array() JROOT/libraries/src/Cache/Controller/CallbackController.php:173 10 Joomla\CMS\Cache\Controller\CallbackController->get() JROOT/libraries/src/Helper/ModuleHelper.php:617 9 Joomla\CMS\Helper\ModuleHelper::moduleCache() JROOT/libraries/src/Document/Renderer/Html/ModuleRenderer.php:95 8 Joomla\CMS\Document\Renderer\Html\ModuleRenderer->render() JROOT/libraries/src/Document/Renderer/Html/ModulesRenderer.php:47 7 Joomla\CMS\Document\Renderer\Html\ModulesRenderer->render() JROOT/libraries/src/Document/HtmlDocument.php:511 6 Joomla\CMS\Document\HtmlDocument->getBuffer() JROOT/libraries/src/Document/HtmlDocument.php:803 5 Joomla\CMS\Document\HtmlDocument->_renderTemplate() JROOT/libraries/src/Document/HtmlDocument.php:577 4 Joomla\CMS\Document\HtmlDocument->render() JROOT/libraries/src/Application/CMSApplication.php:1112 3 Joomla\CMS\Application\CMSApplication->render() JROOT/libraries/src/Application/SiteApplication.php:778 2 Joomla\CMS\Application\SiteApplication->render() JROOT/libraries/src/Application/CMSApplication.php:231 1 Joomla\CMS\Application\CMSApplication->execute() JROOT/index.php:49 - Query Time: 1.31 ms After last query: 0.08 ms Query memory: 0.010 MB Memory before query: 31.140 MB Rows returned: 0Duplicate queries: #178
SELECT *
FROM `w0v41_sppagebuilder`
WHERE `extension` = 'com_k2'
AND `extension_view` = 'itemlist'
AND `view_id` = '89'
AND `active` = 1id select_type table partitions type possible_keys key key_len ref rows filtered Extra 1 SIMPLE w0v41_sppagebuilder NULL ALL NULL NO INDEX KEY COULD BE USED NULL NULL 131 0.76 Using where Status Duration starting 0.06 ms Executing hook on transaction 0.00 ms starting 0.01 ms checking permissions 0.00 ms Opening tables 0.03 ms init 0.00 ms System lock 0.01 ms optimizing 0.01 ms statistics 0.01 ms preparing 0.01 ms executing 1.03 ms end 0.01 ms query end 0.00 ms waiting for handler commit 0.01 ms closing tables 0.01 ms freeing items 0.05 ms cleaning up 0.01 ms # Caller File and line number 21 JDatabaseDriverMysqli->execute() JROOT/libraries/joomla/database/driver.php:1662 20 JDatabaseDriver->loadObject() JROOT/administrator/components/com_sppagebuilder/helpers/sppagebuilder.php:291 19 SppagebuilderHelper::getPageContent() JROOT/administrator/components/com_sppagebuilder/helpers/sppagebuilder.php:248 18 SppagebuilderHelper::onIntegrationPrepareContent() JROOT/plugins/k2/sppagebuilder/sppagebuilder.php:87 17 plgK2Sppagebuilder->onK2PrepareContent() JROOT/libraries/joomla/event/event.php:70 16 JEvent->update() JROOT/libraries/joomla/event/dispatcher.php:160 15 JEventDispatcher->trigger() JROOT/modules/mod_k2_content/helper.php:518 14 modK2ContentHelper::getItems() JROOT/modules/mod_k2_content/mod_k2_content.php:65 13 include JROOT/modules/mod_k2_content/mod_k2_content.php JROOT/libraries/src/Helper/ModuleHelper.php:200 12 Joomla\CMS\Helper\ModuleHelper::renderModule() Same as call in the line below. 11 call_user_func_array() JROOT/libraries/src/Cache/Controller/CallbackController.php:173 10 Joomla\CMS\Cache\Controller\CallbackController->get() JROOT/libraries/src/Helper/ModuleHelper.php:617 9 Joomla\CMS\Helper\ModuleHelper::moduleCache() JROOT/libraries/src/Document/Renderer/Html/ModuleRenderer.php:95 8 Joomla\CMS\Document\Renderer\Html\ModuleRenderer->render() JROOT/libraries/src/Document/Renderer/Html/ModulesRenderer.php:47 7 Joomla\CMS\Document\Renderer\Html\ModulesRenderer->render() JROOT/libraries/src/Document/HtmlDocument.php:511 6 Joomla\CMS\Document\HtmlDocument->getBuffer() JROOT/libraries/src/Document/HtmlDocument.php:803 5 Joomla\CMS\Document\HtmlDocument->_renderTemplate() JROOT/libraries/src/Document/HtmlDocument.php:577 4 Joomla\CMS\Document\HtmlDocument->render() JROOT/libraries/src/Application/CMSApplication.php:1112 3 Joomla\CMS\Application\CMSApplication->render() JROOT/libraries/src/Application/SiteApplication.php:778 2 Joomla\CMS\Application\SiteApplication->render() JROOT/libraries/src/Application/CMSApplication.php:231 1 Joomla\CMS\Application\CMSApplication->execute() JROOT/index.php:49 - Query Time: 0.89 ms After last query: 0.09 ms Query memory: 0.010 MB Memory before query: 31.150 MB Rows returned: 0Duplicate queries: #177
SELECT *
FROM `w0v41_sppagebuilder`
WHERE `extension` = 'com_k2'
AND `extension_view` = 'itemlist'
AND `view_id` = '89'
AND `active` = 1id select_type table partitions type possible_keys key key_len ref rows filtered Extra 1 SIMPLE w0v41_sppagebuilder NULL ALL NULL NO INDEX KEY COULD BE USED NULL NULL 131 0.76 Using where Status Duration starting 0.07 ms Executing hook on transaction 0.00 ms starting 0.01 ms checking permissions 0.01 ms Opening tables 0.03 ms init 0.00 ms System lock 0.01 ms optimizing 0.01 ms statistics 0.01 ms preparing 0.01 ms executing 0.59 ms end 0.01 ms query end 0.00 ms waiting for handler commit 0.01 ms closing tables 0.01 ms freeing items 0.05 ms cleaning up 0.01 ms # Caller File and line number 21 JDatabaseDriverMysqli->execute() JROOT/libraries/joomla/database/driver.php:1662 20 JDatabaseDriver->loadObject() JROOT/administrator/components/com_sppagebuilder/helpers/sppagebuilder.php:291 19 SppagebuilderHelper::getPageContent() JROOT/administrator/components/com_sppagebuilder/helpers/sppagebuilder.php:248 18 SppagebuilderHelper::onIntegrationPrepareContent() JROOT/plugins/k2/sppagebuilder/sppagebuilder.php:89 17 plgK2Sppagebuilder->onK2PrepareContent() JROOT/libraries/joomla/event/event.php:70 16 JEvent->update() JROOT/libraries/joomla/event/dispatcher.php:160 15 JEventDispatcher->trigger() JROOT/modules/mod_k2_content/helper.php:518 14 modK2ContentHelper::getItems() JROOT/modules/mod_k2_content/mod_k2_content.php:65 13 include JROOT/modules/mod_k2_content/mod_k2_content.php JROOT/libraries/src/Helper/ModuleHelper.php:200 12 Joomla\CMS\Helper\ModuleHelper::renderModule() Same as call in the line below. 11 call_user_func_array() JROOT/libraries/src/Cache/Controller/CallbackController.php:173 10 Joomla\CMS\Cache\Controller\CallbackController->get() JROOT/libraries/src/Helper/ModuleHelper.php:617 9 Joomla\CMS\Helper\ModuleHelper::moduleCache() JROOT/libraries/src/Document/Renderer/Html/ModuleRenderer.php:95 8 Joomla\CMS\Document\Renderer\Html\ModuleRenderer->render() JROOT/libraries/src/Document/Renderer/Html/ModulesRenderer.php:47 7 Joomla\CMS\Document\Renderer\Html\ModulesRenderer->render() JROOT/libraries/src/Document/HtmlDocument.php:511 6 Joomla\CMS\Document\HtmlDocument->getBuffer() JROOT/libraries/src/Document/HtmlDocument.php:803 5 Joomla\CMS\Document\HtmlDocument->_renderTemplate() JROOT/libraries/src/Document/HtmlDocument.php:577 4 Joomla\CMS\Document\HtmlDocument->render() JROOT/libraries/src/Application/CMSApplication.php:1112 3 Joomla\CMS\Application\CMSApplication->render() JROOT/libraries/src/Application/SiteApplication.php:778 2 Joomla\CMS\Application\SiteApplication->render() JROOT/libraries/src/Application/CMSApplication.php:231 1 Joomla\CMS\Application\CMSApplication->execute() JROOT/index.php:49 - Query Time: 0.36 ms After last query: 0.07 ms Query memory: 0.007 MB Memory before query: 31.157 MB Rows returned: 1
SELECT `description`, `gender`
FROM w0v41_k2_users
WHERE userID=112
LIMIT 0, 1id select_type table partitions type possible_keys key key_len ref rows filtered Extra 1 SIMPLE w0v41_k2_users NULL ref userID userID 4 const 1 100.00 NULL Status Duration starting 0.08 ms Executing hook on transaction 0.01 ms starting 0.01 ms checking permissions 0.01 ms Opening tables 0.02 ms init 0.01 ms System lock 0.01 ms optimizing 0.01 ms statistics 0.06 ms preparing 0.01 ms executing 0.03 ms end 0.00 ms query end 0.00 ms waiting for handler commit 0.01 ms closing tables 0.01 ms freeing items 0.05 ms cleaning up 0.01 ms # Caller File and line number 16 JDatabaseDriverMysqli->execute() JROOT/libraries/joomla/database/driver.php:1662 15 JDatabaseDriver->loadObject() JROOT/modules/mod_k2_content/helper.php:550 14 modK2ContentHelper::getItems() JROOT/modules/mod_k2_content/mod_k2_content.php:65 13 include JROOT/modules/mod_k2_content/mod_k2_content.php JROOT/libraries/src/Helper/ModuleHelper.php:200 12 Joomla\CMS\Helper\ModuleHelper::renderModule() Same as call in the line below. 11 call_user_func_array() JROOT/libraries/src/Cache/Controller/CallbackController.php:173 10 Joomla\CMS\Cache\Controller\CallbackController->get() JROOT/libraries/src/Helper/ModuleHelper.php:617 9 Joomla\CMS\Helper\ModuleHelper::moduleCache() JROOT/libraries/src/Document/Renderer/Html/ModuleRenderer.php:95 8 Joomla\CMS\Document\Renderer\Html\ModuleRenderer->render() JROOT/libraries/src/Document/Renderer/Html/ModulesRenderer.php:47 7 Joomla\CMS\Document\Renderer\Html\ModulesRenderer->render() JROOT/libraries/src/Document/HtmlDocument.php:511 6 Joomla\CMS\Document\HtmlDocument->getBuffer() JROOT/libraries/src/Document/HtmlDocument.php:803 5 Joomla\CMS\Document\HtmlDocument->_renderTemplate() JROOT/libraries/src/Document/HtmlDocument.php:577 4 Joomla\CMS\Document\HtmlDocument->render() JROOT/libraries/src/Application/CMSApplication.php:1112 3 Joomla\CMS\Application\CMSApplication->render() JROOT/libraries/src/Application/SiteApplication.php:778 2 Joomla\CMS\Application\SiteApplication->render() JROOT/libraries/src/Application/CMSApplication.php:231 1 Joomla\CMS\Application\CMSApplication->execute() JROOT/index.php:49 - Query Time: 0.94 ms After last query: 4.00 ms Query memory: 0.007 MB Memory before query: 31.117 MB Rows returned: 34
SELECT i.id
FROM w0v41_k2_items as i
LEFT JOIN w0v41_k2_categories c
ON c.id = i.catid
WHERE i.published=1
AND ( i.publish_up = '0000-00-00 00:00:00' OR i.publish_up <= '2025-08-29 16:29:05' )
AND ( i.publish_down = '0000-00-00 00:00:00' OR i.publish_down >= '2025-08-29 16:29:05' )
AND i.trash=0
AND i.access IN(1,1,5)
AND c.published=1
AND c.trash=0
AND c.access IN(1,1,5)
AND c.language IN ('en-GB', '*')
AND i.language IN ('en-GB', '*')id select_type table partitions type possible_keys key key_len ref rows filtered Extra 1 SIMPLE c NULL ref PRIMARY,category,published,access,trash,language,idx_category trash 2 const 13 57.14 Using index condition; Using where 1 SIMPLE i NULL ref catid,language,idx_item catid 4 h88876_SDAT.c.id 10 1.39 Using index condition; Using where Status Duration starting 0.15 ms Executing hook on transaction 0.01 ms starting 0.01 ms checking permissions 0.01 ms checking permissions 0.00 ms Opening tables 0.06 ms init 0.01 ms System lock 0.01 ms optimizing 0.03 ms statistics 0.17 ms preparing 0.03 ms executing 0.33 ms end 0.01 ms query end 0.00 ms waiting for handler commit 0.01 ms closing tables 0.01 ms freeing items 0.06 ms cleaning up 0.01 ms # Caller File and line number 16 JDatabaseDriverMysqli->execute() JROOT/libraries/joomla/database/driver.php:1550 15 JDatabaseDriver->loadColumn() JROOT/modules/mod_k2_tools/helper.php:275 14 modK2ToolsHelper::tagCloud() JROOT/modules/mod_k2_tools/mod_k2_tools.php:85 13 include JROOT/modules/mod_k2_tools/mod_k2_tools.php JROOT/libraries/src/Helper/ModuleHelper.php:200 12 Joomla\CMS\Helper\ModuleHelper::renderModule() Same as call in the line below. 11 call_user_func_array() JROOT/libraries/src/Cache/Controller/CallbackController.php:173 10 Joomla\CMS\Cache\Controller\CallbackController->get() JROOT/libraries/src/Helper/ModuleHelper.php:617 9 Joomla\CMS\Helper\ModuleHelper::moduleCache() JROOT/libraries/src/Document/Renderer/Html/ModuleRenderer.php:95 8 Joomla\CMS\Document\Renderer\Html\ModuleRenderer->render() JROOT/libraries/src/Document/Renderer/Html/ModulesRenderer.php:47 7 Joomla\CMS\Document\Renderer\Html\ModulesRenderer->render() JROOT/libraries/src/Document/HtmlDocument.php:511 6 Joomla\CMS\Document\HtmlDocument->getBuffer() JROOT/libraries/src/Document/HtmlDocument.php:803 5 Joomla\CMS\Document\HtmlDocument->_renderTemplate() JROOT/libraries/src/Document/HtmlDocument.php:577 4 Joomla\CMS\Document\HtmlDocument->render() JROOT/libraries/src/Application/CMSApplication.php:1112 3 Joomla\CMS\Application\CMSApplication->render() JROOT/libraries/src/Application/SiteApplication.php:778 2 Joomla\CMS\Application\SiteApplication->render() JROOT/libraries/src/Application/CMSApplication.php:231 1 Joomla\CMS\Application\CMSApplication->execute() JROOT/index.php:49 - Query Time: 0.70 ms After last query: 0.05 ms Query memory: 0.007 MB Memory before query: 31.128 MB Rows returned: 107
SELECT tag.name, tag.id
FROM w0v41_k2_tags as tag
LEFT JOIN w0v41_k2_tags_xref AS xref
ON xref.tagID = tag.id
WHERE xref.itemID IN (1,9,11,12,13,26,33,34,36,39,43,46,48,49,55,57,58,61,67,68,72,77,79,81,83,85,89,90,95,97,99,2,4,63)
AND tag.published = 1id select_type table partitions type possible_keys key key_len ref rows filtered Extra 1 SIMPLE xref NULL ALL tagID,itemID NO INDEX KEY COULD BE USED NULL NULL 253 45.06 Using where 1 SIMPLE tag NULL eq_ref PRIMARY,published PRIMARY 4 h88876_SDAT.xref.tagID 1 100.00 Using where Status Duration starting 0.07 ms Executing hook on transaction 0.00 ms starting 0.01 ms checking permissions 0.00 ms checking permissions 0.00 ms Opening tables 0.03 ms init 0.01 ms System lock 0.01 ms optimizing 0.01 ms statistics 0.14 ms preparing 0.02 ms executing 0.29 ms end 0.01 ms query end 0.00 ms waiting for handler commit 0.01 ms closing tables 0.01 ms freeing items 0.05 ms cleaning up 0.01 ms # Caller File and line number 16 JDatabaseDriverMysqli->execute() JROOT/libraries/joomla/database/driver.php:1701 15 JDatabaseDriver->loadObjectList() JROOT/modules/mod_k2_tools/helper.php:287 14 modK2ToolsHelper::tagCloud() JROOT/modules/mod_k2_tools/mod_k2_tools.php:85 13 include JROOT/modules/mod_k2_tools/mod_k2_tools.php JROOT/libraries/src/Helper/ModuleHelper.php:200 12 Joomla\CMS\Helper\ModuleHelper::renderModule() Same as call in the line below. 11 call_user_func_array() JROOT/libraries/src/Cache/Controller/CallbackController.php:173 10 Joomla\CMS\Cache\Controller\CallbackController->get() JROOT/libraries/src/Helper/ModuleHelper.php:617 9 Joomla\CMS\Helper\ModuleHelper::moduleCache() JROOT/libraries/src/Document/Renderer/Html/ModuleRenderer.php:95 8 Joomla\CMS\Document\Renderer\Html\ModuleRenderer->render() JROOT/libraries/src/Document/Renderer/Html/ModulesRenderer.php:47 7 Joomla\CMS\Document\Renderer\Html\ModulesRenderer->render() JROOT/libraries/src/Document/HtmlDocument.php:511 6 Joomla\CMS\Document\HtmlDocument->getBuffer() JROOT/libraries/src/Document/HtmlDocument.php:803 5 Joomla\CMS\Document\HtmlDocument->_renderTemplate() JROOT/libraries/src/Document/HtmlDocument.php:577 4 Joomla\CMS\Document\HtmlDocument->render() JROOT/libraries/src/Application/CMSApplication.php:1112 3 Joomla\CMS\Application\CMSApplication->render() JROOT/libraries/src/Application/SiteApplication.php:778 2 Joomla\CMS\Application\SiteApplication->render() JROOT/libraries/src/Application/CMSApplication.php:231 1 Joomla\CMS\Application\CMSApplication->execute() JROOT/index.php:49 - Query Time: 0.71 ms After last query: 6.20 ms Query memory: 0.007 MB Memory before query: 31.241 MB Rows returned: 2
SELECT `c2`.`language`,`c2`.`id`
FROM `w0v41_menu` AS `c`
INNER JOIN `w0v41_associations` AS `a`
ON a.id = c.`id`
AND a.context='com_menus.item'
INNER JOIN `w0v41_associations` AS `a2`
ON `a`.`key` = `a2`.`key`
INNER JOIN `w0v41_menu` AS `c2`
ON a2.id = c2.`id`
WHERE c.id = 197id select_type table partitions type possible_keys key key_len ref rows filtered Extra 1 SIMPLE c NULL const PRIMARY PRIMARY 4 const 1 100.00 Using index 1 SIMPLE a NULL const PRIMARY,idx_key PRIMARY 206 const,const 1 100.00 NULL 1 SIMPLE a2 NULL ref idx_key idx_key 128 const 2 100.00 Using index 1 SIMPLE c2 NULL eq_ref PRIMARY PRIMARY 4 h88876_SDAT.a2.id 1 100.00 NULL Status Duration starting 0.10 ms Executing hook on transaction 0.01 ms starting 0.01 ms checking permissions 0.01 ms checking permissions 0.00 ms checking permissions 0.00 ms checking permissions 0.01 ms Opening tables 0.30 ms init 0.01 ms System lock 0.01 ms optimizing 0.01 ms statistics 0.09 ms preparing 0.01 ms executing 0.03 ms end 0.01 ms query end 0.00 ms waiting for handler commit 0.01 ms closing tables 0.02 ms freeing items 0.05 ms cleaning up 0.01 ms # Caller File and line number 15 JDatabaseDriverMysqli->execute() JROOT/libraries/joomla/database/driver.php:1701 14 JDatabaseDriver->loadObjectList() JROOT/libraries/src/Language/Associations.php:115 13 Joomla\CMS\Language\Associations::getAssociations() JROOT/administrator/components/com_menus/helpers/menus.php:321 12 MenusHelper::getAssociations() JROOT/modules/mod_languages/helper.php:58 11 ModLanguagesHelper::getList() JROOT/modules/mod_languages/mod_languages.php:17 10 include JROOT/modules/mod_languages/mod_languages.php JROOT/libraries/src/Helper/ModuleHelper.php:200 9 Joomla\CMS\Helper\ModuleHelper::renderModule() JROOT/libraries/src/Document/Renderer/Html/ModuleRenderer.php:98 8 Joomla\CMS\Document\Renderer\Html\ModuleRenderer->render() JROOT/libraries/src/Document/Renderer/Html/ModulesRenderer.php:47 7 Joomla\CMS\Document\Renderer\Html\ModulesRenderer->render() JROOT/libraries/src/Document/HtmlDocument.php:511 6 Joomla\CMS\Document\HtmlDocument->getBuffer() JROOT/libraries/src/Document/HtmlDocument.php:803 5 Joomla\CMS\Document\HtmlDocument->_renderTemplate() JROOT/libraries/src/Document/HtmlDocument.php:577 4 Joomla\CMS\Document\HtmlDocument->render() JROOT/libraries/src/Application/CMSApplication.php:1112 3 Joomla\CMS\Application\CMSApplication->render() JROOT/libraries/src/Application/SiteApplication.php:778 2 Joomla\CMS\Application\SiteApplication->render() JROOT/libraries/src/Application/CMSApplication.php:231 1 Joomla\CMS\Application\CMSApplication->execute() JROOT/index.php:49 - Query Time: 0.38 ms After last query: 4.26 ms Query memory: 0.006 MB Memory before query: 31.370 MB Rows returned: 0
SELECT *
FROM w0v41_jmap_metainfo
WHERE `linkurl` = 'https://sdat.ir/en/sdat-blog'
AND `published` = 1id select_type table partitions type possible_keys key key_len ref rows filtered Extra 1 SIMPLE w0v41_jmap_metainfo NULL ref published published 1 const 1 100.00 Using where Status Duration starting 0.08 ms Executing hook on transaction 0.01 ms starting 0.01 ms checking permissions 0.01 ms Opening tables 0.10 ms init 0.01 ms System lock 0.01 ms optimizing 0.01 ms statistics 0.03 ms preparing 0.01 ms executing 0.02 ms end 0.00 ms query end 0.00 ms waiting for handler commit 0.01 ms closing tables 0.01 ms freeing items 0.05 ms cleaning up 0.01 ms # Caller File and line number 14 JDatabaseDriverMysqli->execute() JROOT/libraries/joomla/database/driver.php:1662 13 JDatabaseDriver->loadObject() JROOT/plugins/system/jmap/jmap.php:429 12 plgSystemJMap->onBeforeCompileHead() JROOT/libraries/joomla/event/event.php:70 11 JEvent->update() JROOT/libraries/joomla/event/dispatcher.php:160 10 JEventDispatcher->trigger() JROOT/libraries/src/Application/BaseApplication.php:108 9 Joomla\CMS\Application\BaseApplication->triggerEvent() JROOT/libraries/src/Document/Renderer/Html/HeadRenderer.php:67 8 Joomla\CMS\Document\Renderer\Html\HeadRenderer->fetchHead() JROOT/libraries/src/Document/Renderer/Html/HeadRenderer.php:38 7 Joomla\CMS\Document\Renderer\Html\HeadRenderer->render() JROOT/libraries/src/Document/HtmlDocument.php:511 6 Joomla\CMS\Document\HtmlDocument->getBuffer() JROOT/libraries/src/Document/HtmlDocument.php:803 5 Joomla\CMS\Document\HtmlDocument->_renderTemplate() JROOT/libraries/src/Document/HtmlDocument.php:577 4 Joomla\CMS\Document\HtmlDocument->render() JROOT/libraries/src/Application/CMSApplication.php:1112 3 Joomla\CMS\Application\CMSApplication->render() JROOT/libraries/src/Application/SiteApplication.php:778 2 Joomla\CMS\Application\SiteApplication->render() JROOT/libraries/src/Application/CMSApplication.php:231 1 Joomla\CMS\Application\CMSApplication->execute() JROOT/index.php:49 - Query Time: 0.29 ms After last query: 0.04 ms Query memory: 0.006 MB Memory before query: 31.376 MB Rows returned: 0
SELECT *
FROM w0v41_jmap_canonicals
WHERE `linkurl` = 'https://sdat.ir/en/sdat-blog'id select_type table partitions type possible_keys key key_len ref rows filtered Extra 1 SIMPLE w0v41_jmap_canonicals NULL ALL NULL NO INDEX KEY COULD BE USED NULL NULL 1 100.00 Using where Status Duration starting 0.06 ms Executing hook on transaction 0.00 ms starting 0.01 ms checking permissions 0.01 ms Opening tables 0.07 ms init 0.01 ms System lock 0.01 ms optimizing 0.01 ms statistics 0.01 ms preparing 0.02 ms executing 0.02 ms end 0.00 ms query end 0.00 ms waiting for handler commit 0.01 ms closing tables 0.01 ms freeing items 0.05 ms cleaning up 0.01 ms # Caller File and line number 14 JDatabaseDriverMysqli->execute() JROOT/libraries/joomla/database/driver.php:1662 13 JDatabaseDriver->loadObject() JROOT/plugins/system/jmap/jmap.php:508 12 plgSystemJMap->onBeforeCompileHead() JROOT/libraries/joomla/event/event.php:70 11 JEvent->update() JROOT/libraries/joomla/event/dispatcher.php:160 10 JEventDispatcher->trigger() JROOT/libraries/src/Application/BaseApplication.php:108 9 Joomla\CMS\Application\BaseApplication->triggerEvent() JROOT/libraries/src/Document/Renderer/Html/HeadRenderer.php:67 8 Joomla\CMS\Document\Renderer\Html\HeadRenderer->fetchHead() JROOT/libraries/src/Document/Renderer/Html/HeadRenderer.php:38 7 Joomla\CMS\Document\Renderer\Html\HeadRenderer->render() JROOT/libraries/src/Document/HtmlDocument.php:511 6 Joomla\CMS\Document\HtmlDocument->getBuffer() JROOT/libraries/src/Document/HtmlDocument.php:803 5 Joomla\CMS\Document\HtmlDocument->_renderTemplate() JROOT/libraries/src/Document/HtmlDocument.php:577 4 Joomla\CMS\Document\HtmlDocument->render() JROOT/libraries/src/Application/CMSApplication.php:1112 3 Joomla\CMS\Application\CMSApplication->render() JROOT/libraries/src/Application/SiteApplication.php:778 2 Joomla\CMS\Application\SiteApplication->render() JROOT/libraries/src/Application/CMSApplication.php:231 1 Joomla\CMS\Application\CMSApplication->execute() JROOT/index.php:49 - Query Time: 0.43 ms After last query: 12.86 ms Query memory: 0.004 MB Memory before query: 31.630 MB Rows returned: 0
SELECT *
FROM w0v41_jmap_headings
WHERE `linkurl` = 'https://sdat.ir/en/sdat-blog'id select_type table partitions type possible_keys key key_len ref rows filtered Extra 1 SIMPLE w0v41_jmap_headings NULL ALL NULL NO INDEX KEY COULD BE USED NULL NULL 1 100.00 Using where Status Duration starting 0.10 ms Executing hook on transaction 0.01 ms starting 0.01 ms checking permissions 0.01 ms Opening tables 0.12 ms init 0.01 ms System lock 0.01 ms optimizing 0.01 ms statistics 0.01 ms preparing 0.02 ms executing 0.03 ms end 0.00 ms query end 0.01 ms waiting for handler commit 0.01 ms closing tables 0.01 ms freeing items 0.05 ms cleaning up 0.01 ms # Caller File and line number 9 JDatabaseDriverMysqli->execute() JROOT/libraries/joomla/database/driver.php:1662 8 JDatabaseDriver->loadObject() JROOT/plugins/system/jmap/jmap.php:819 7 plgSystemJMap->onAfterRender() JROOT/libraries/joomla/event/event.php:70 6 JEvent->update() JROOT/libraries/joomla/event/dispatcher.php:160 5 JEventDispatcher->trigger() JROOT/libraries/src/Application/BaseApplication.php:108 4 Joomla\CMS\Application\BaseApplication->triggerEvent() JROOT/libraries/src/Application/CMSApplication.php:1118 3 Joomla\CMS\Application\CMSApplication->render() JROOT/libraries/src/Application/SiteApplication.php:778 2 Joomla\CMS\Application\SiteApplication->render() JROOT/libraries/src/Application/CMSApplication.php:231 1 Joomla\CMS\Application\CMSApplication->execute() JROOT/index.php:49
58 Query Types Logged, Sorted by Occurrences.
SELECT Tables:
35 × SELECT *
FROM w0v41_eventgallery_file20 × SELECT *
FROM `w0v41_sppagebuilder`18 × SELECT COUNT(*)
FROM w0v41_k2_items11 × SELECT enabled
FROM w0v41_extensions10 × SELECT tag.*
FROM w0v41_k2_tags AS tag JOIN w0v41_k2_tags_xref AS xref
ON tag.id = xref.tagID9 × SELECT *
FROM w0v41_k2_categories5 × SELECT *
FROM w0v41_k2_attachments5 × SELECT COUNT(*)
FROM w0v41_k2_comments5 × SELECT `description`, `gender`
FROM w0v41_k2_users4 × SELECT t.*
FROM w0v41_eventgallery_imagetypeset_imagetype tsta
left join w0v41_eventgallery_imagetype t
on tsta.imagetypeid=t.id3 × SELECT *
FROM `w0v41_users`3 × SELECT id, gender, description, image, url, `
group`, plugins
FROM w0v41_k2_users3 × SELECT `g`.`id`,`g`.`title`
FROM `w0v41_usergroups` AS g
INNER JOIN `w0v41_user_usergroup_map` AS m
ON m.group_id = g.id3 × SELECT id, alias, parent
FROM w0v41_k2_categories2 × SELECT file.*
FROM `w0v41_eventgallery_file` AS file2 × SELECT `m`.`tag_id`,`t`.*
FROM `w0v41_contentitem_tag_map` AS m
INNER JOIN `w0v41_tags` AS t
ON `m`.`tag_id` = `t`.`id`2 × SELECT *
FROM w0v41_extensions2 × SELECT `extension_id`
FROM `w0v41_extensions`2 × SELECT template
FROM w0v41_template_styles as s2 × SELECT t.*, tsta.default as defaultimagetype
FROM w0v41_eventgallery_imagetypeset_imagetype tsta
left join w0v41_eventgallery_imagetype t
on tsta.imagetypeid=t.id1 × SELECT *
FROM w0v41_eventgallery_imagetypeset1 × SELECT f.*
FROM w0v41_eventgallery_folder1 × SELECT `session_id`
FROM `w0v41_session`1 × SELECT *
FROM w0v41_eventgallery_imagetyp1 × SELECT c.*, i.catid, i.title, i.alias, category.alias AS catalias, category.name AS categoryname
FROM w0v41_k2_comments AS c
LEFT JOIN w0v41_k2_items AS i
ON i.id = c.itemID
LEFT JOIN w0v41_k2_categories AS category
ON category.id = i.catid1 × SELECT i.id
FROM w0v41_k2_items as i
LEFT JOIN w0v41_k2_categories c
ON c.id = i.catid1 × SELECT tag.name, tag.id
FROM w0v41_k2_tags as tag
LEFT JOIN w0v41_k2_tags_xref AS xref
ON xref.tagID = tag.id1 × SELECT `c2`.`language`,`c2`.`id`
FROM `w0v41_menu` AS `c`
INNER JOIN `w0v41_associations` AS `a`
ON a.id = c.`id`
AND a.context='com_menus.item'
INNER JOIN `w0v41_associations` AS `a2`
ON `a`.`key` = `a2`.`key`
INNER JOIN `w0v41_menu` AS `c2`
ON a2.id = c2.`id`1 × SELECT *
FROM w0v41_jmap_metainfo1 × SELECT *
FROM w0v41_jmap_canonicals1 × SELECT DISTINCT a.id, a.title, a.name, a.checked_out, a.checked_out_time, a.note, a.state, a.access, a.created_time, a.created_user_id, a.ordering, a.language, a.fieldparams, a.params, a.type, a.default_value, a.context, a.group_id, a.label, a.description, a.required,l.title AS language_title, l.image AS language_image,uc.name AS editor,ag.title AS access_level,ua.name AS author_name,g.title AS group_title, g.access as group_access, g.state AS group_state, g.note as group_note
FROM w0v41_fields AS a
LEFT JOIN `w0v41_languages` AS l
ON l.lang_code = a.language
LEFT JOIN w0v41_users AS uc
ON uc.id=a.checked_out
LEFT JOIN w0v41_viewlevels AS ag
ON ag.id = a.access
LEFT JOIN w0v41_users AS ua
ON ua.id = a.created_user_id
LEFT JOIN w0v41_fields_groups AS g
ON g.id = a.group_id1 × SELECT *
FROM w0v41_acymailing_confi1 × SELECT DISTINCT MONTH(created) as m, YEAR(created) as y
FROM w0v41_k2_items1 × SELECT DISTINCT a.id, a.title, a.name, a.checked_out, a.checked_out_time, a.note, a.state, a.access, a.created_time, a.created_user_id, a.ordering, a.language, a.fieldparams, a.params, a.type, a.default_value, a.context, a.group_id, a.label, a.description, a.required,l.title AS language_title, l.image AS language_image,uc.name AS editor,ag.title AS access_level,ua.name AS author_name,g.title AS group_title, g.access as group_access, g.state AS group_state, g.note as group_note
FROM w0v41_fields AS a
LEFT JOIN `w0v41_languages` AS l
ON l.lang_code = a.language
LEFT JOIN w0v41_users AS uc
ON uc.id=a.checked_out
LEFT JOIN w0v41_viewlevels AS ag
ON ag.id = a.access
LEFT JOIN w0v41_users AS ua
ON ua.id = a.created_user_id
LEFT JOIN w0v41_fields_groups AS g
ON g.id = a.group_id
LEFT JOIN `w0v41_fields_categories` AS fc
ON fc.field_id = a.id1 × SELECT b.id
FROM w0v41_usergroups AS a
LEFT JOIN w0v41_usergroups AS b
ON b.lft <= a.lft
AND b.rgt >= a.rgt1 × SELECT `name`
FROM `w0v41_extensions`1 × SELECT extension, file, type
FROM w0v41_rokcommon_configs1 × SELECT *
FROM w0v41_rsform_confi1 × SELECT `id`,`name`,`rules`,`parent_id`
FROM `w0v41_assets`1 × SELECT id
FROM w0v41_k2_categories1 × SELECT FOUND_ROWS()
1 × SELECT id
FROM w0v41_k2_categories1 × SELECT id, name, parent
FROM w0v41_k2_categories1 × SELECT folder.*
FROM `w0v41_eventgallery_folder` AS folder
LEFT JOIN `w0v41_eventgallery_file` AS file
ON folder.folder = file.folder
and file.published=1
and file.ismainimage=01 × SELECT language,id
FROM `w0v41_menu`1 × SELECT m.id, m.title, m.module, m.position, m.content, m.showtitle, m.params, mm.menuid
FROM w0v41_modules AS m
LEFT JOIN w0v41_modules_menu AS mm
ON mm.moduleid = m.id
LEFT JOIN w0v41_extensions AS e
ON e.element = m.module
AND e.client_id = m.client_id1 × SELECT id, rules
FROM `w0v41_viewlevels1 × SELECT *
FROM w0v41_acymailing_list1 × SELECT *
FROM `w0v41_acymailing_fields` as a1 × SELECT *
FROM `w0v41_acymailing_fields1 × SELECT *
FROM w0v41_jmap_headings
OTHER Tables:
2 × /* Frontend / mod_k2_content */ SELECT i.*, c.name AS categoryname, c.id AS categoryid, c.alias AS categoryalias, c.params AS categoryparams
FROM w0v41_k2_items AS i
INNER JOIN w0v41_k2_categories AS c
ON c.id = i.catid1 × INSERT INTO `w0v41_session` (`session_id`,`guest`,`time`,`userid`,`username`,`client_id`)
VALUES (X'3263316135326537646232366461343764646339343931653135363736373138', 1, 1756484945, 0, '', 01 × SHOW FULL COLUMNS
FROM `w0v41_extensions1 × UPDATE `w0v41_extensions`
SET `params` = '{\"mediaversion\":\"8750cfe38c60672549245d1ab9ead606\"}'1 × /* Frontend / K2 / Items */ SELECT /*+ MAX_EXECUTION_TIME(60000) */ SQL_CALC_FOUND_ROWS i.*, c.name AS categoryname, c.id AS categoryid, c.alias AS categoryalias, c.params AS categoryparams
FROM w0v41_k2_items AS i
INNER JOIN w0v41_k2_categories AS c USE INDEX (idx_category)
ON c.id = i.catid1 × SHOW FULL COLUMNS
FROM `w0v41_k2_categories1 × SHOW FULL COLUMNS
FROM `w0v41_users