Print this page
Friday, 08 January 2021 07:03

A synergetic R-Shiny portal for modeling and tracking of COVID-19 data Featured

Rate this item
(1 Vote)

Dr. Mahdi Salehi, an associate member of SDAT and assistant professor of statistics at the University of Neyshabur, introduced a useful online interactive dashboard that visualize and follows confirmed cases of COVID-19 in real-time. The dashboard was publicly made available on 6 April 2020 to illustrate the counts of confirmed cases, deaths, and recoveries of COVID-19 at the level of country or continent. This dashboard is intended as a user-friendly dashboard for researchers as well as the general public to track the COVID-19 pandemic, and is generated from trusted data sources and built-in open-source R software (Shiny in particular); ensuring a high sense of transparency and reproducibility.

Access the shiny dashboard: https://mahdisalehi.shinyapps.io/Covid19Dashboard/


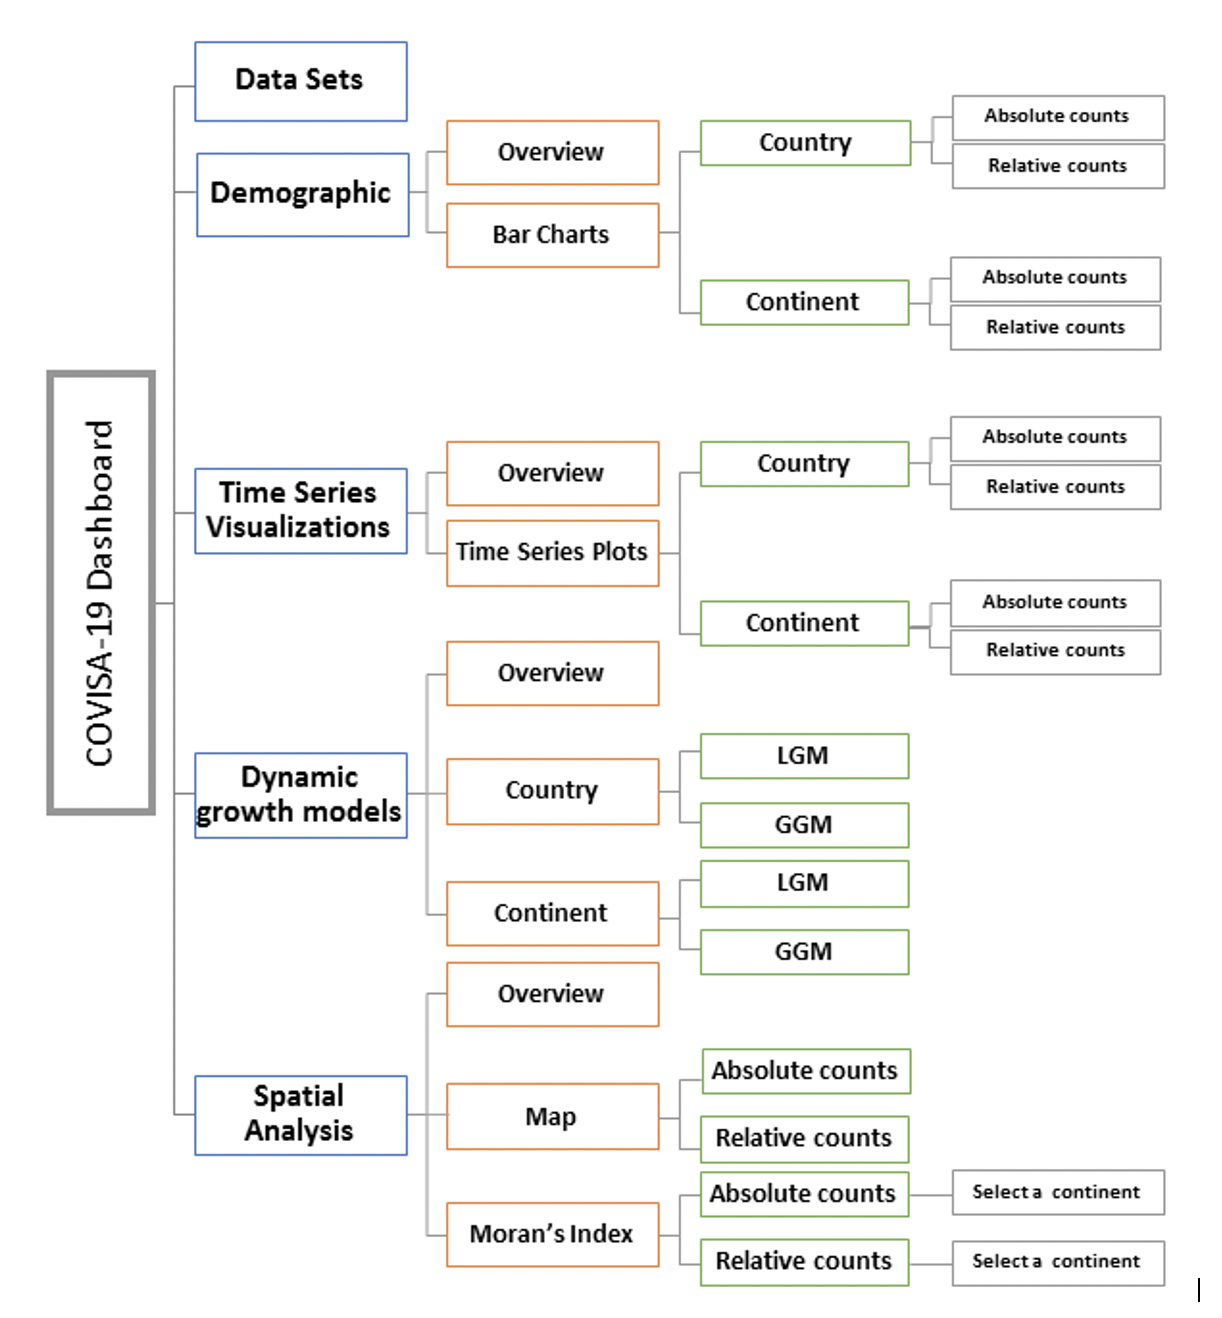
The R Shiny framework serves as a platform for visualization and analysis of the data, as well as an advance to capitalize on existing data curation to support and enable open science. The coded analysis here includes logistic and Gompertz growth models, as two mathematical tools for forecasting the future of the COVID-19 pandemic, as well as the Moran's index metric, which gives a spatial perspective via heat maps that may assist in the identification of latent responses and behavioral patterns. This analysis provides real-time statistical application aiming to make sense to academic- and public consumers of the large amount of data that is being accumulated due to the COVID-19 pandemic. In order to see more details on the dashboard, see Salehi et al. (2020).

covid19 dash

Reference:

[1] Salehi M, Arashi M, Bekker A, Ferreira J, Chen D-G, Esmaeili F, and Frances M (2020). A Synergetic R-Shiny Portal for Modeling and Tracking of COVID-19 Data. Front. Public Health 8:623624.doi: 10.3389/fpubh.2020.623624.

Read 3542 times Last modified on Friday, 08 January 2021 07:46

Related items