General News

General News (3)

Thursday, 04 May 2017 16:18

KDD bigdas 2017

Rate this item
(0 votes)

The first workshop on Big data analytics-as-a-Service: Architecture, Algorithms, and Applications in Health Informatics is taking place on August 14, 2017 (in conjunction with KDD 2017) in Halifax, Nova Scotia, Canada. The workshop will consist of a combination of invited keynote speakers, panel discussion, and paper/poster presentations. We allocate significant time for open discussions on sharing best practices and future directions. 

Workshop homepage: http://bigdas.org 

Call for Papers

This is a new and emerging area for the KDD community and we hope this workshop will bring together researchers and interested audiences to explore the open problems, applications, and future directions in Big data analytics-as- a-Service: Architecture, Algorithms, and Applications in Health Informatics. We invite submission of papers explaining innovative research studies on all aspects of big data analytics and its application in health informatics. Work-in-progress papers, demos, experimental studies, open-source developments, and visionary papers are also welcome. Suggested topics include (but are not limited to) the following with the focus of health informatics application area:

    • Big data machine learning algorithms
        Big data semi-supervised learning, active learning, inductive inference, organizational learning, evolutional learning, transfer learning, manifold learning, probabilistic and relational learning
        Big data deep learning
        Big data decision support systems
        Big data scientific visualization
        Big temporal data mining
        Big data time series and sequential pattern mining
        Big data clinical/biomedical text analytics
        Automatic semantic annotation of medical content
        Large-scale classification, clustering, and interpretation of biomedical images and videos
        Genetic data analytics, mining big gene databases and biological databases
    • Gold Standards
        Feature engineering considerations and selection
        Algorithm considerations and selection
        Analysis selection criteria
    • Systems Architecture
        Infrastructures for big data analytics
        Scalable and high throughput systems for large-scale data analytics
        Performance evaluation or comparative study of big data analytics tools, such as DataMelt, RapidMiner, Orange, Rattle, Apache Spark MLlib, Apache Mahout, etc.
        Performance evaluation or comparative study of Machine Learning as a Service platforms, such as BigML, Microsoft Azure, Amazon Machine Learning, Google Cloud Prediction API, IBM Watson Analytics, etc.
        Integration PaaS (iPaaS) supporting Big Data applications and services
        Application of cloud computing to big data analytics
    • Big data analytics-as-a-Service
        Big data machine learning-as-a-Service
        Turning big data health informatics into WWW services
        Big data deep learning-as-a-Service
        Big data infrastructure-as-a-Service
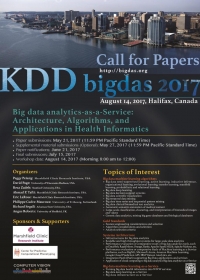
Important Dates:

Paper submissions: May 21, 2017 (11:59 PM Pacific Standard Time)
Supplemental material submissions (Optional): May 27, 2017 (11:59 PM Pacific Standard Time)
Paper notifications: June 21, 2017
Final submissions: July, 10, 2017
Workshop date: August 14, 2017 (Morning 8:00 am to 12:00)


Rate this item
(0 votes)

Integrates the theory and applications of statistics using R. A Course in Statistics with R has been written to bridge the gap between theory and applications and explain how mathematical expressions are converted into R programs. The book has been primarily designed as a useful companion for a Masters student during each semester of the course, but will also help applied statisticians in revisiting the underpinnings of the subject. With this dual goal in mind, the book begins with R basics and quickly covers visualization and exploratory analysis. Probability and statistical inference, inclusive of classical, nonparametric, and Bayesian schools, is developed with definitions, motivations, mathematical expression and R programs in a way which will help the reader to understand the mathematical development as well as R implementation. Linear regression models, experimental designs, multivariate analysis, and categorical data analysis are treated in a way which makes effective use of visualization techniques and the related statistical techniques underlying them through practical applications, and hence helps the reader to achieve a clear understanding of the associated statistical models.

Rate this item
(0 votes)

On Tuesday, analytics company SAS announced Viya, its new analytics and visualization architecture. A SAS spokeswoman said Viya would become the "foundation for all future SAS products."

The goal of Viya is to make analytics more accessible to all users and to better support cloud-native apps and data stored in the cloud.

The announcement came at the 2016 SAS Global Forum, the company's annual conference for SAS users and executives, which took place in Las Vegas. Viya will be available as part of an early adopter program in May, but it will reach general availability sometime in Q3 of 2016.

About Us

SDAT is an abbreviation for Scientific Data Analysis Team. It consists of groups who are specialists in various fields of data sciences including Statistical Analytics, Business Analytics, Big Data Analytics and Health Analytics. 

Get In Touch

Address:  No.15 13th West Street, North Sarrafan, Apt. No. 1 Saadat Abad- Tehran

 Phone: +98-910-199-2800

Email: info@sdat.ir

Login Form